Abstract
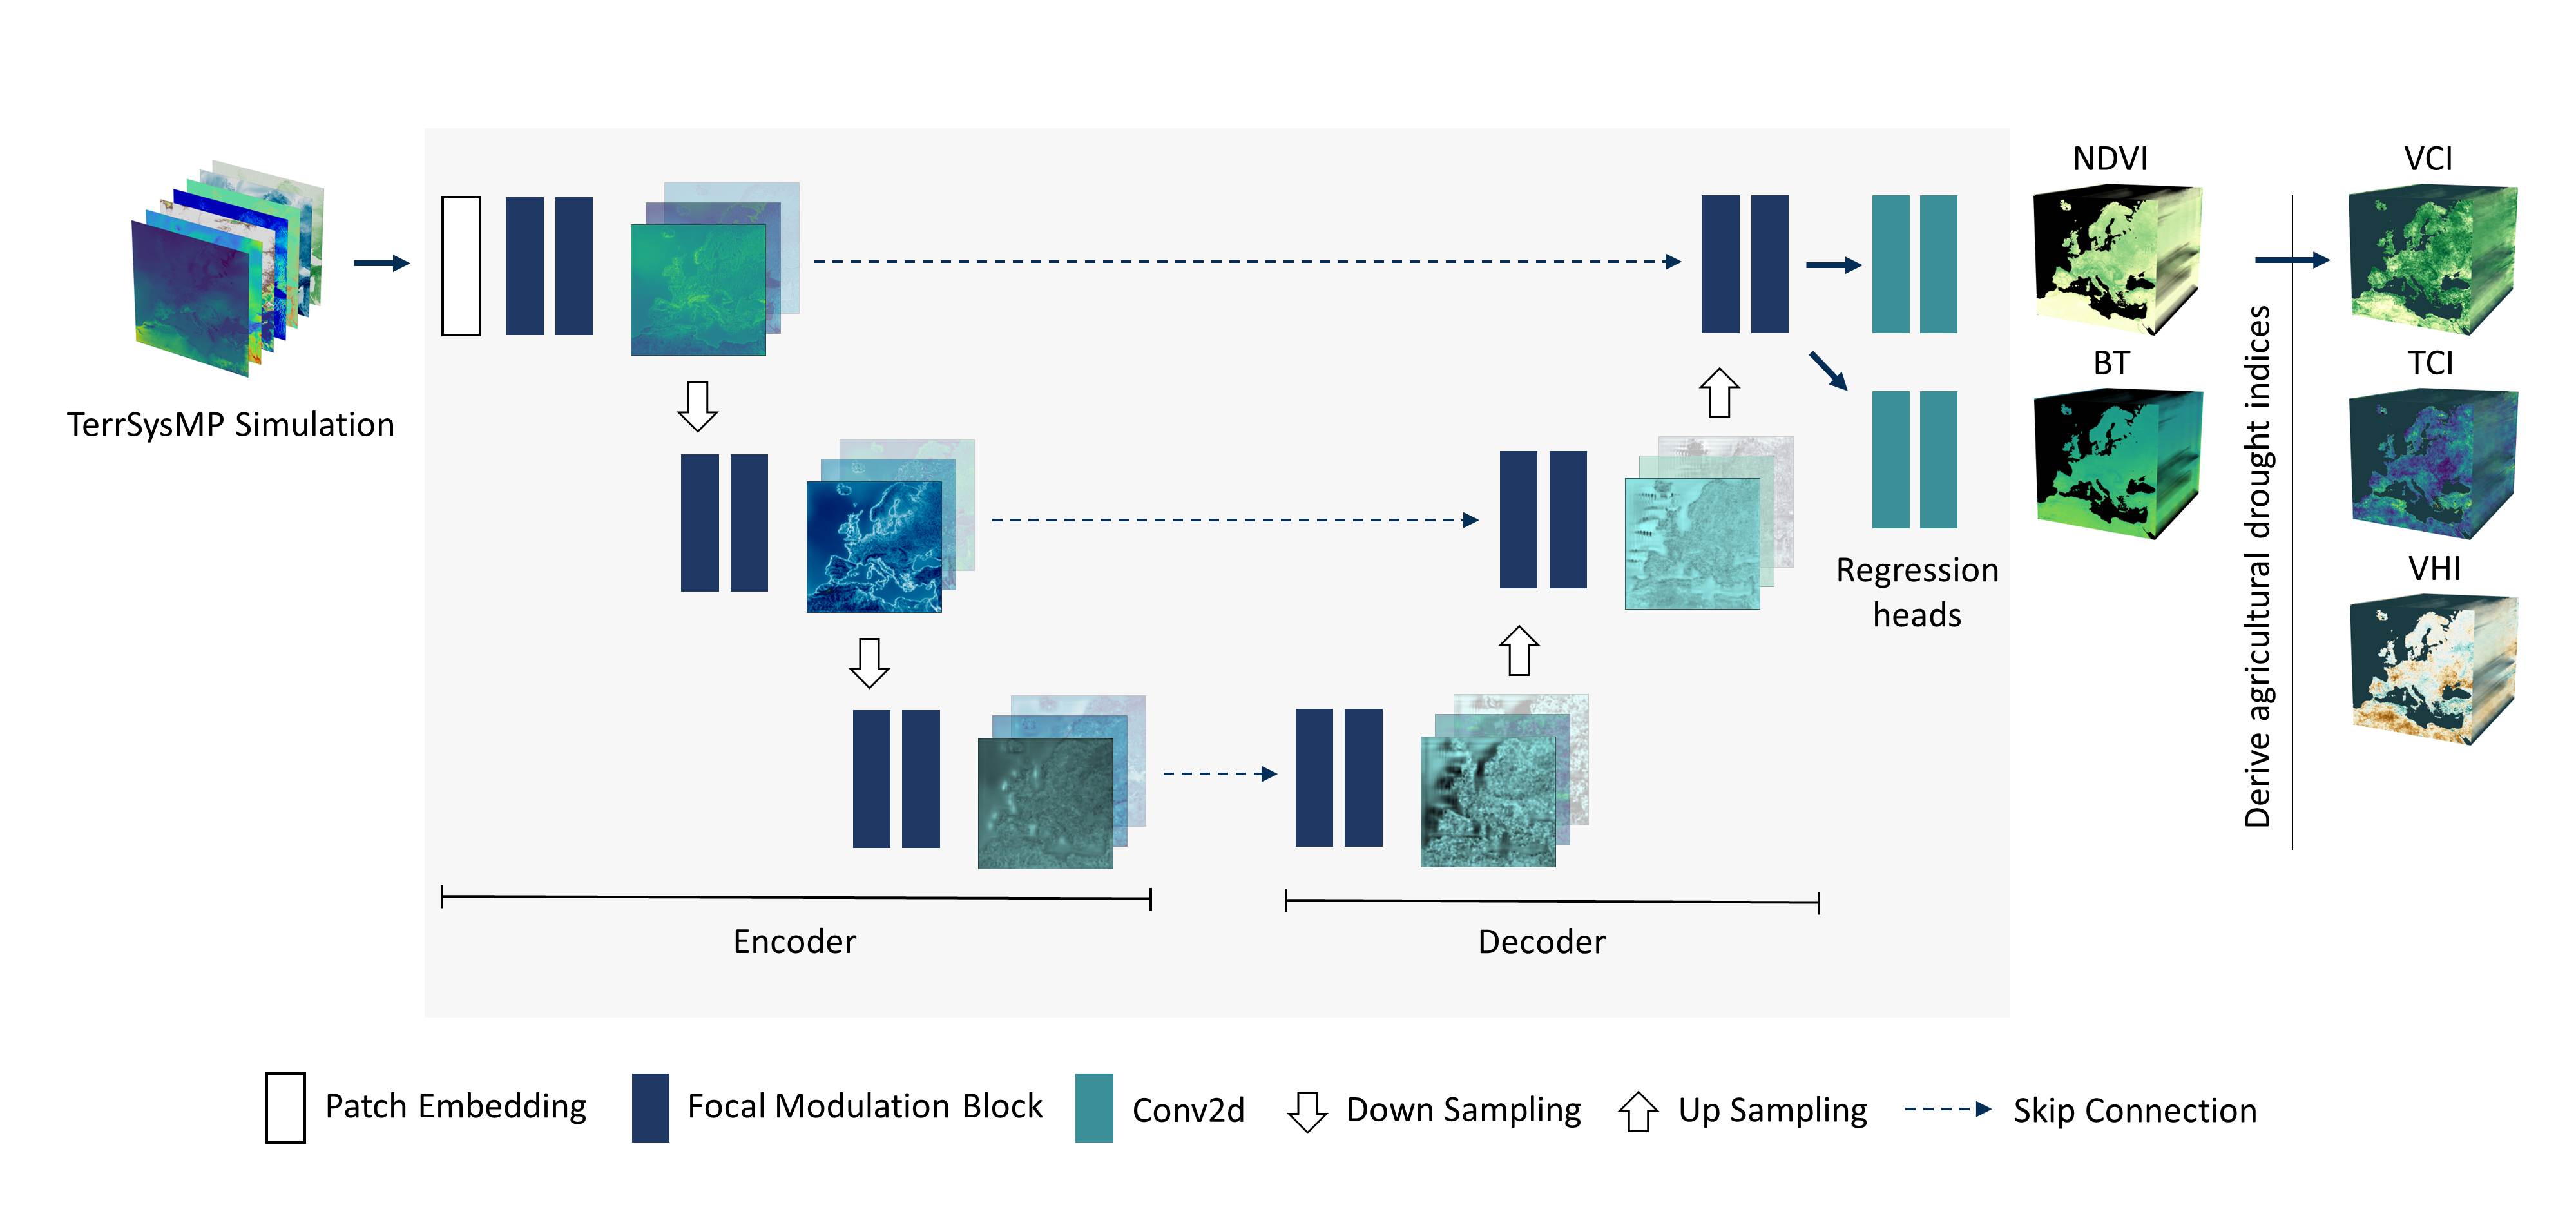
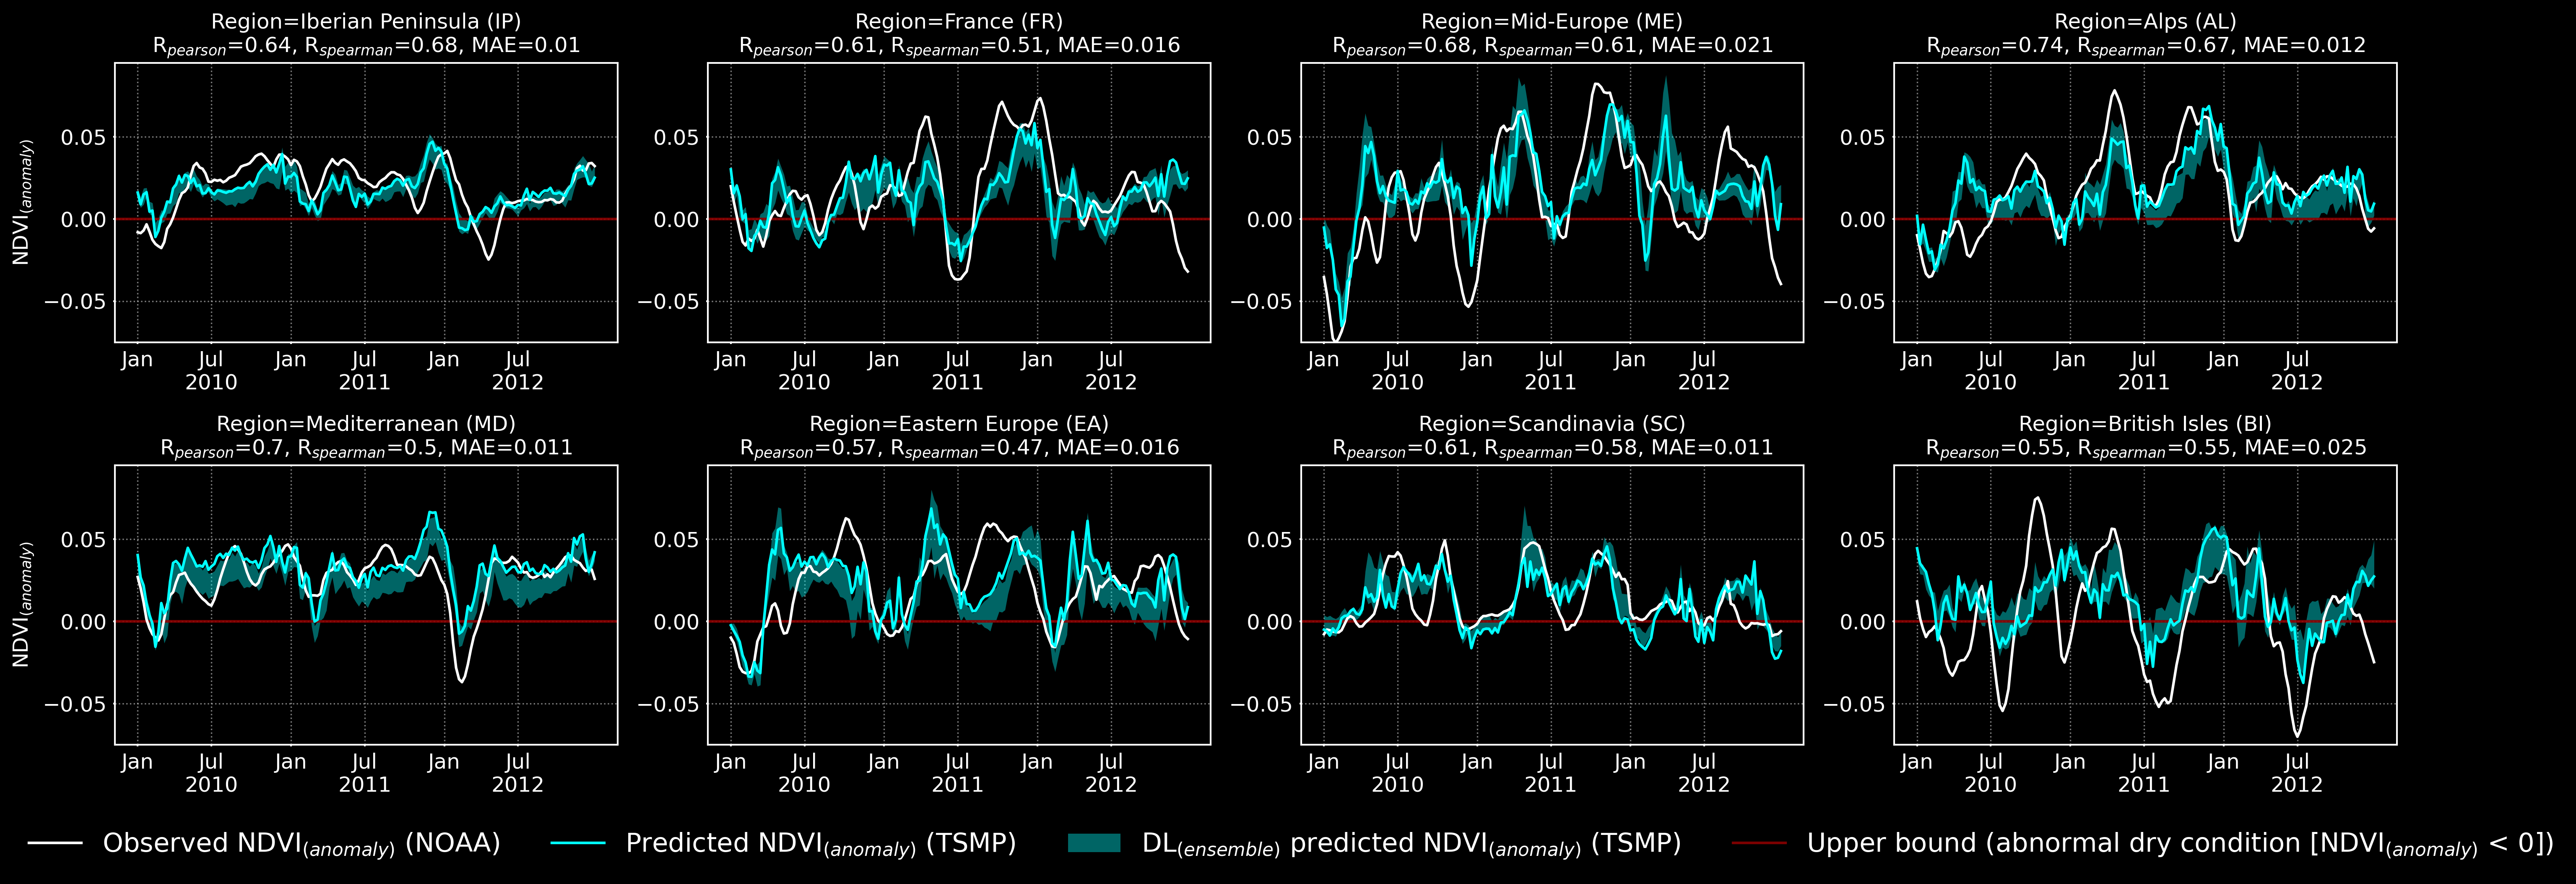
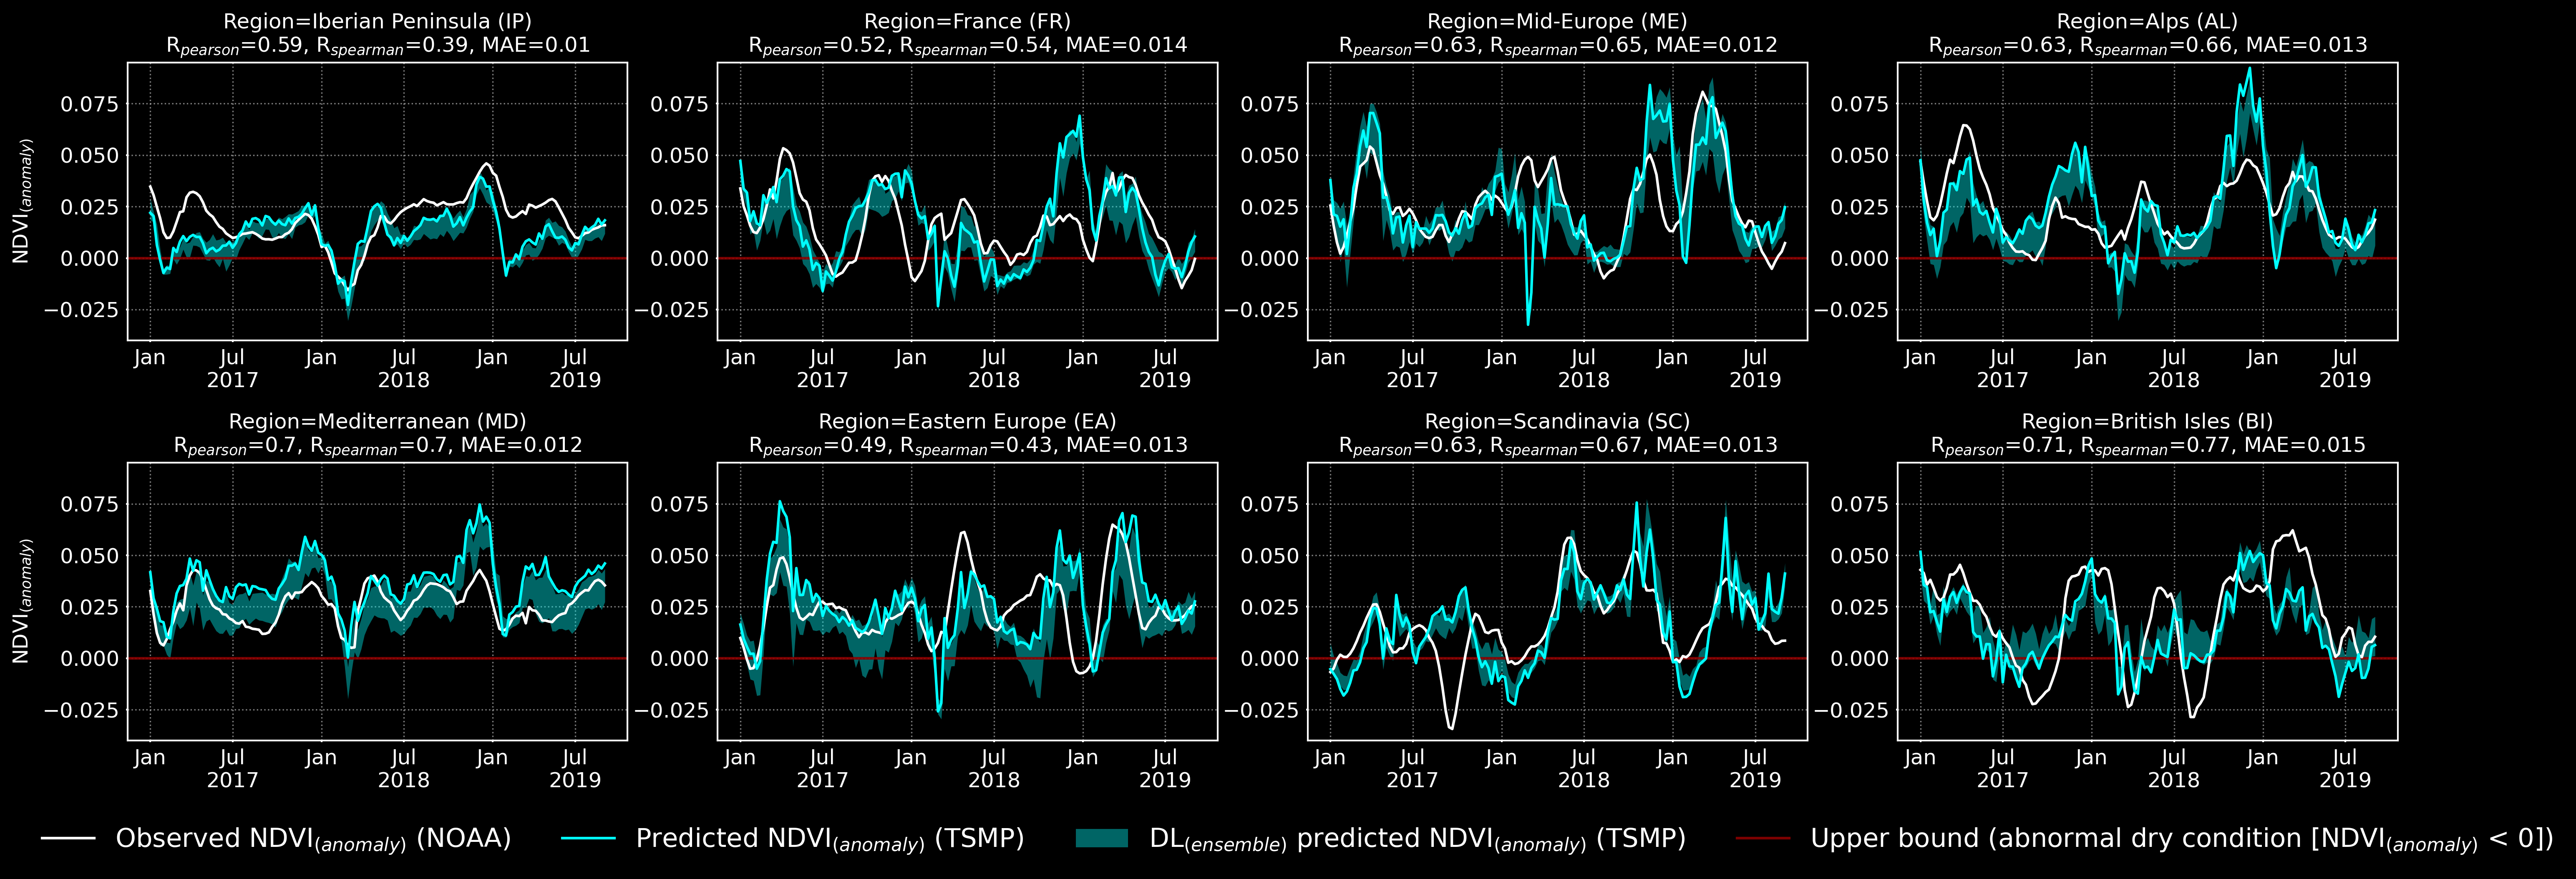
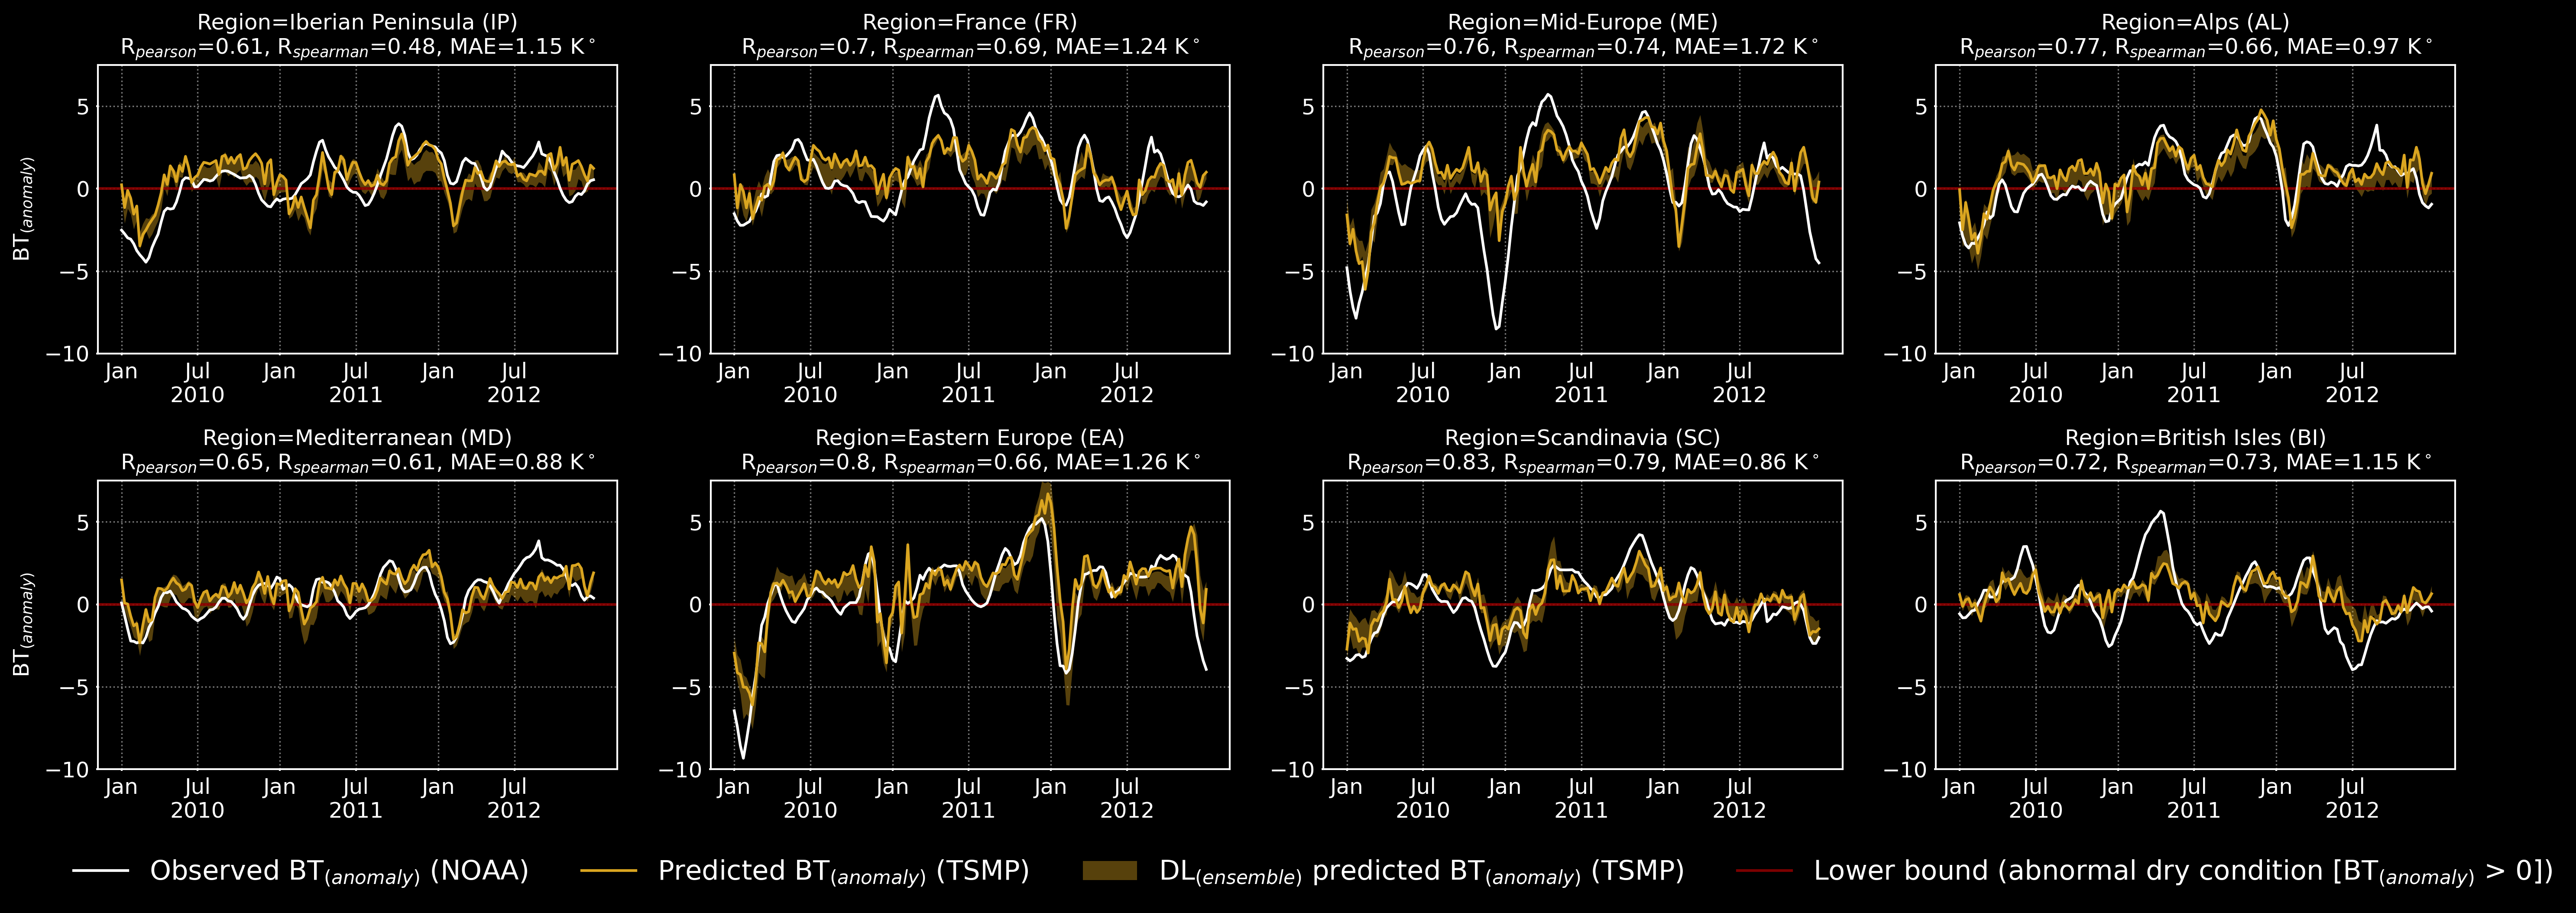
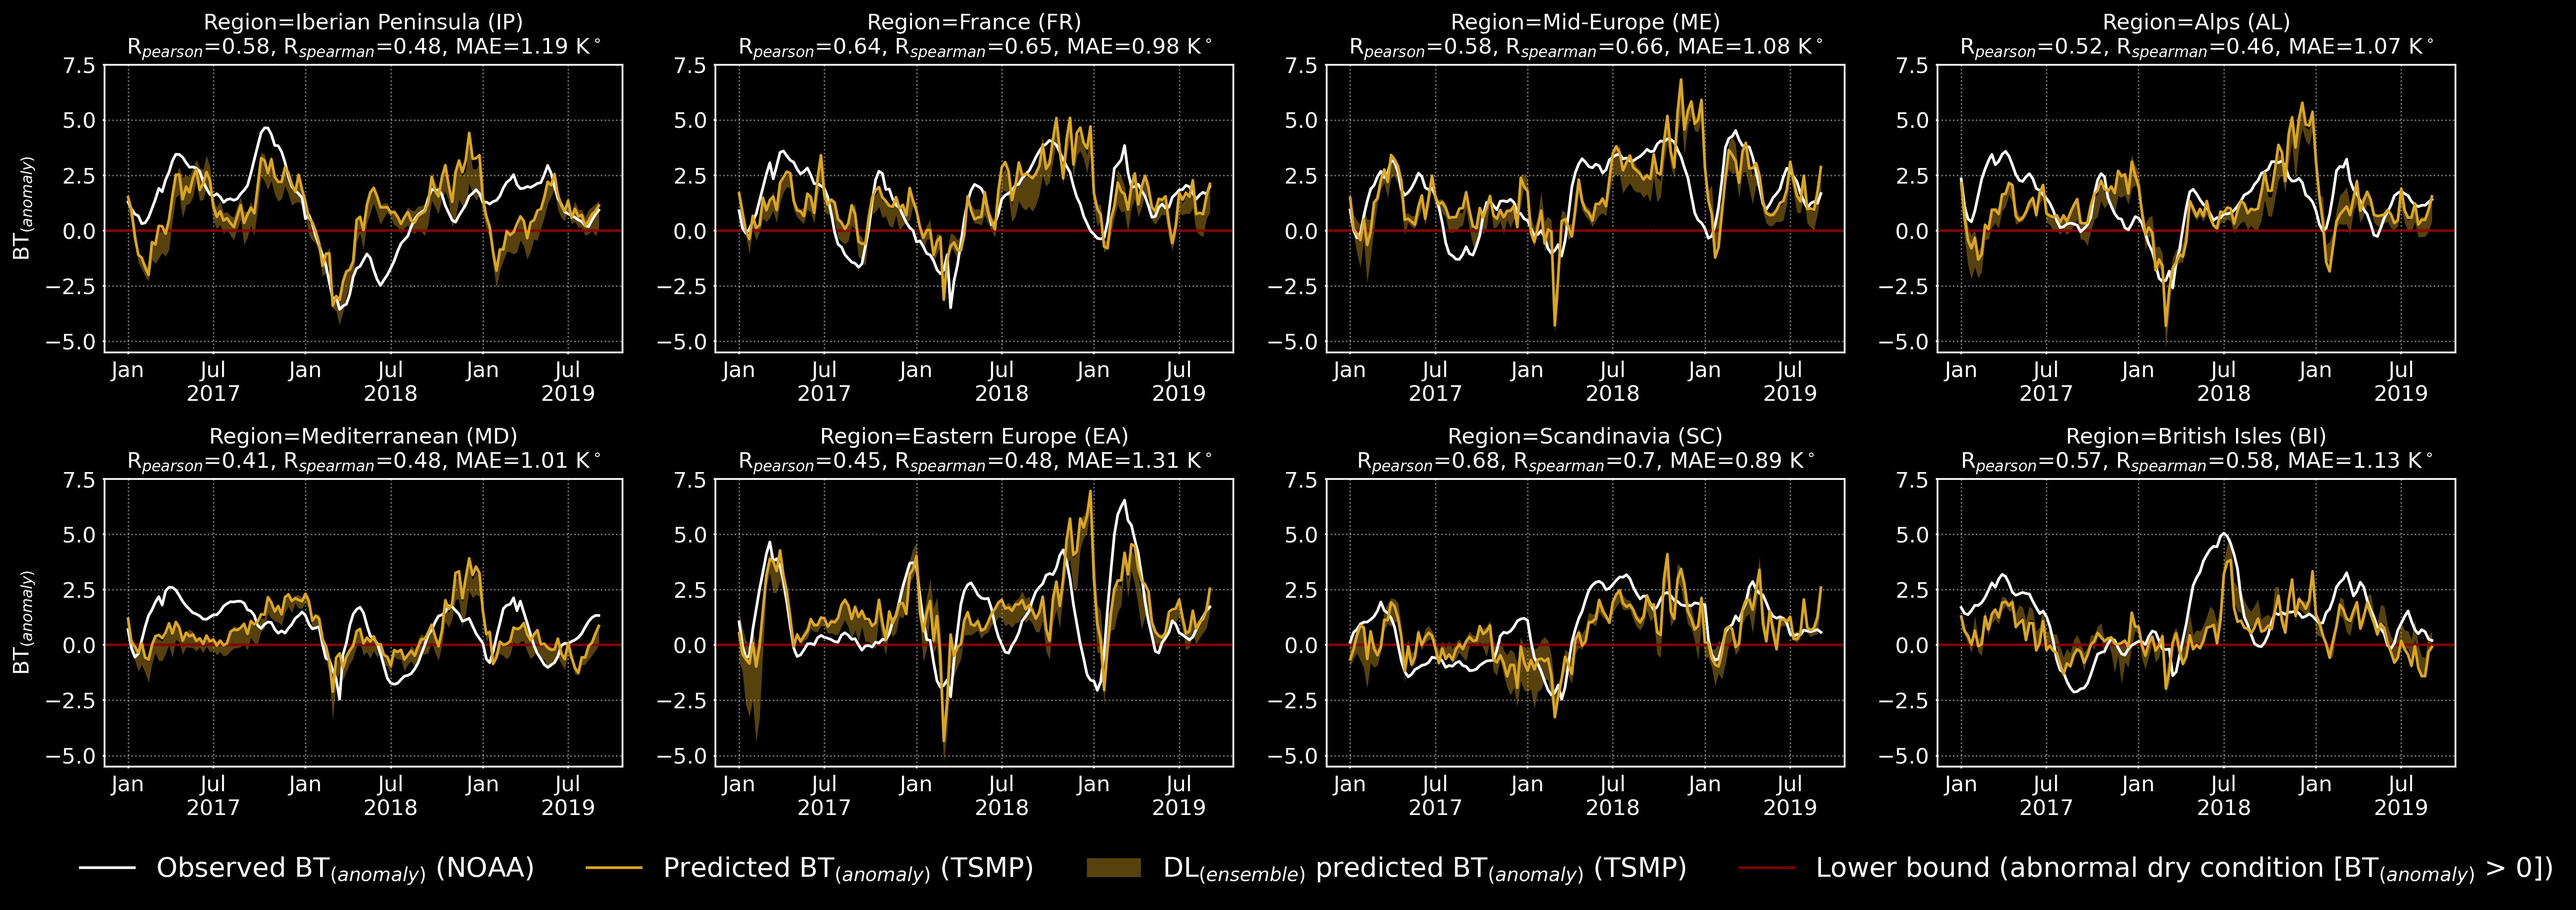
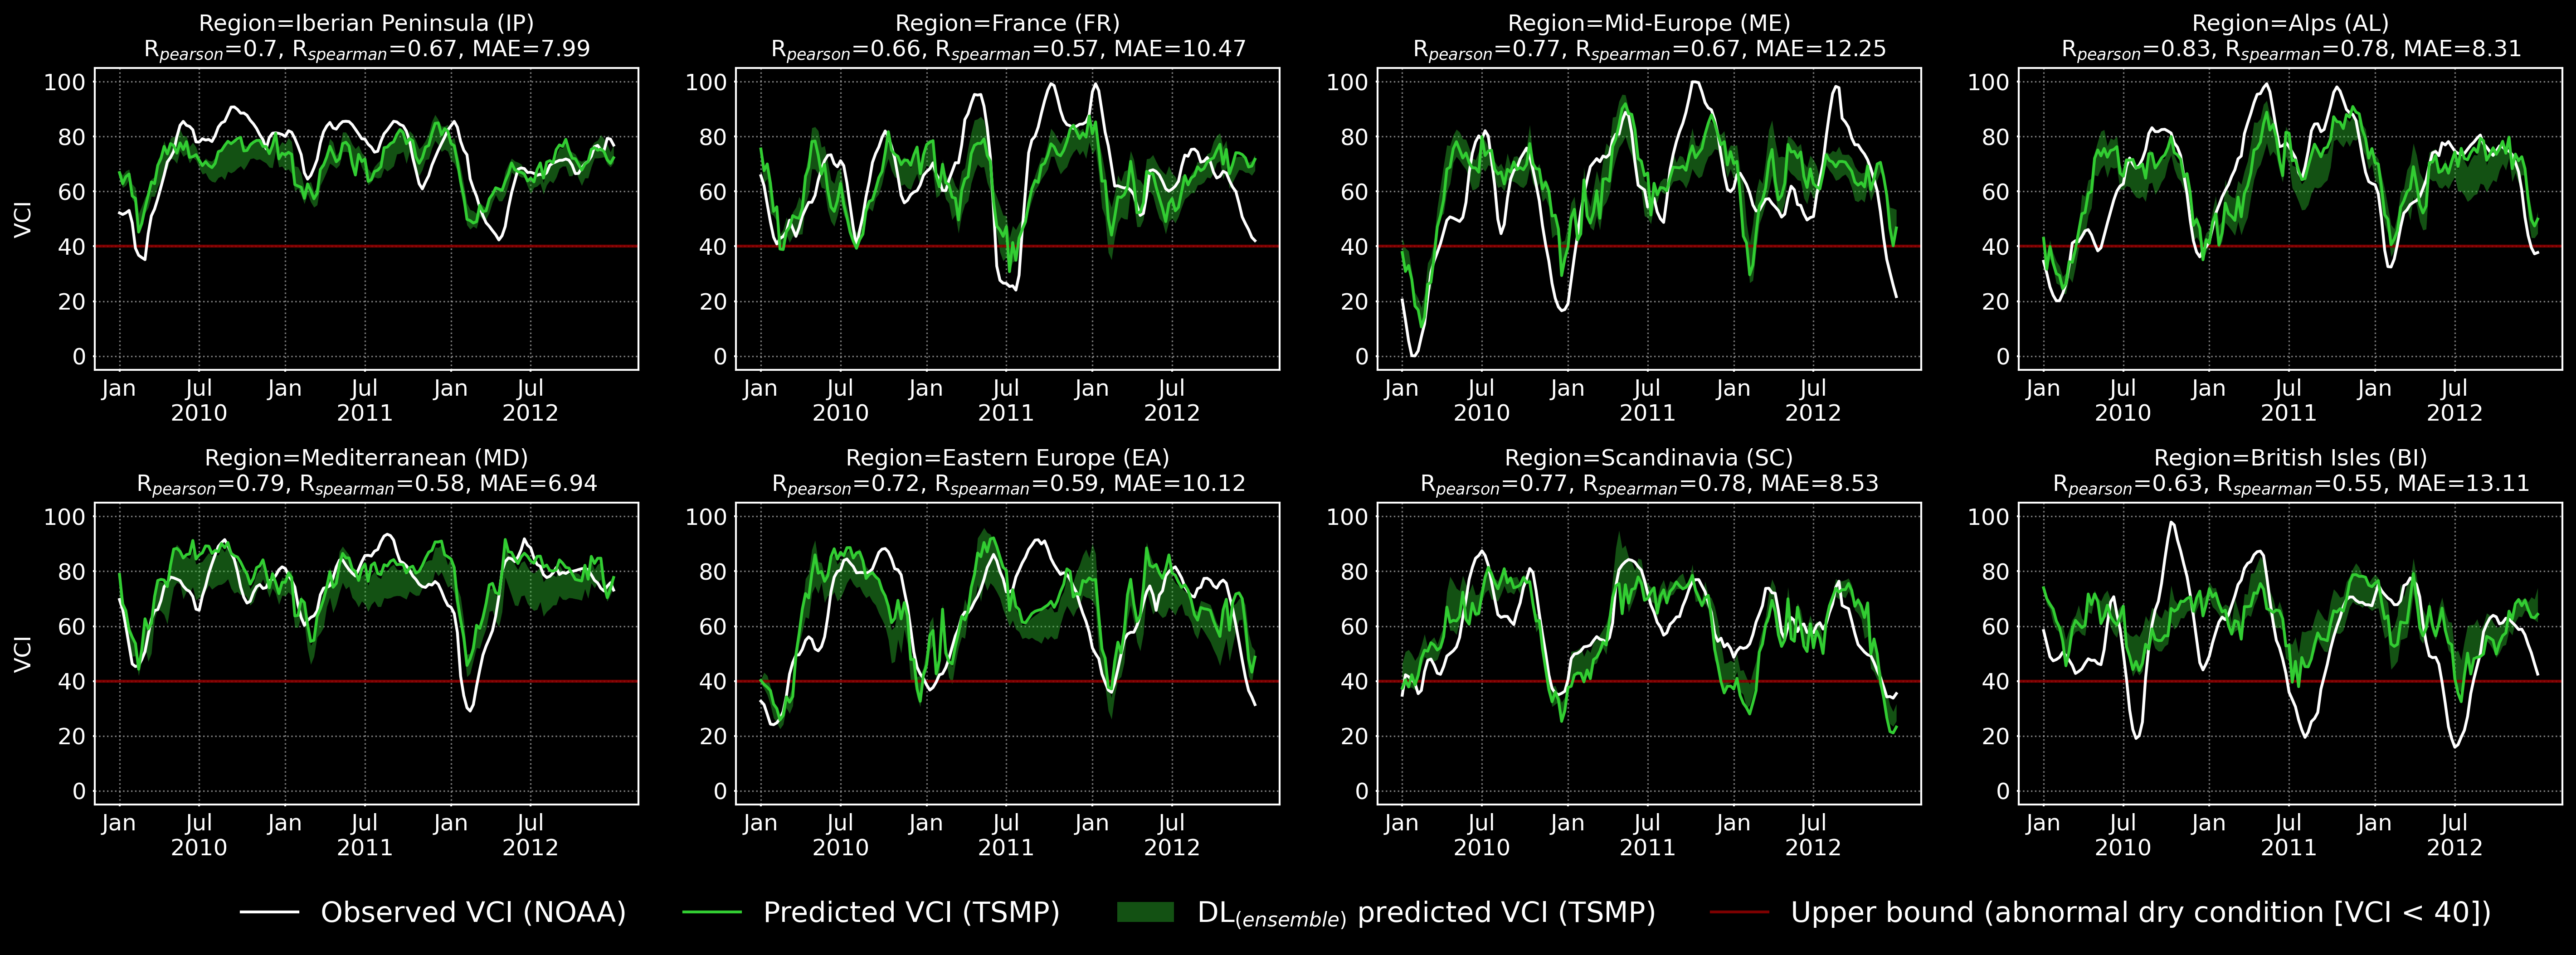
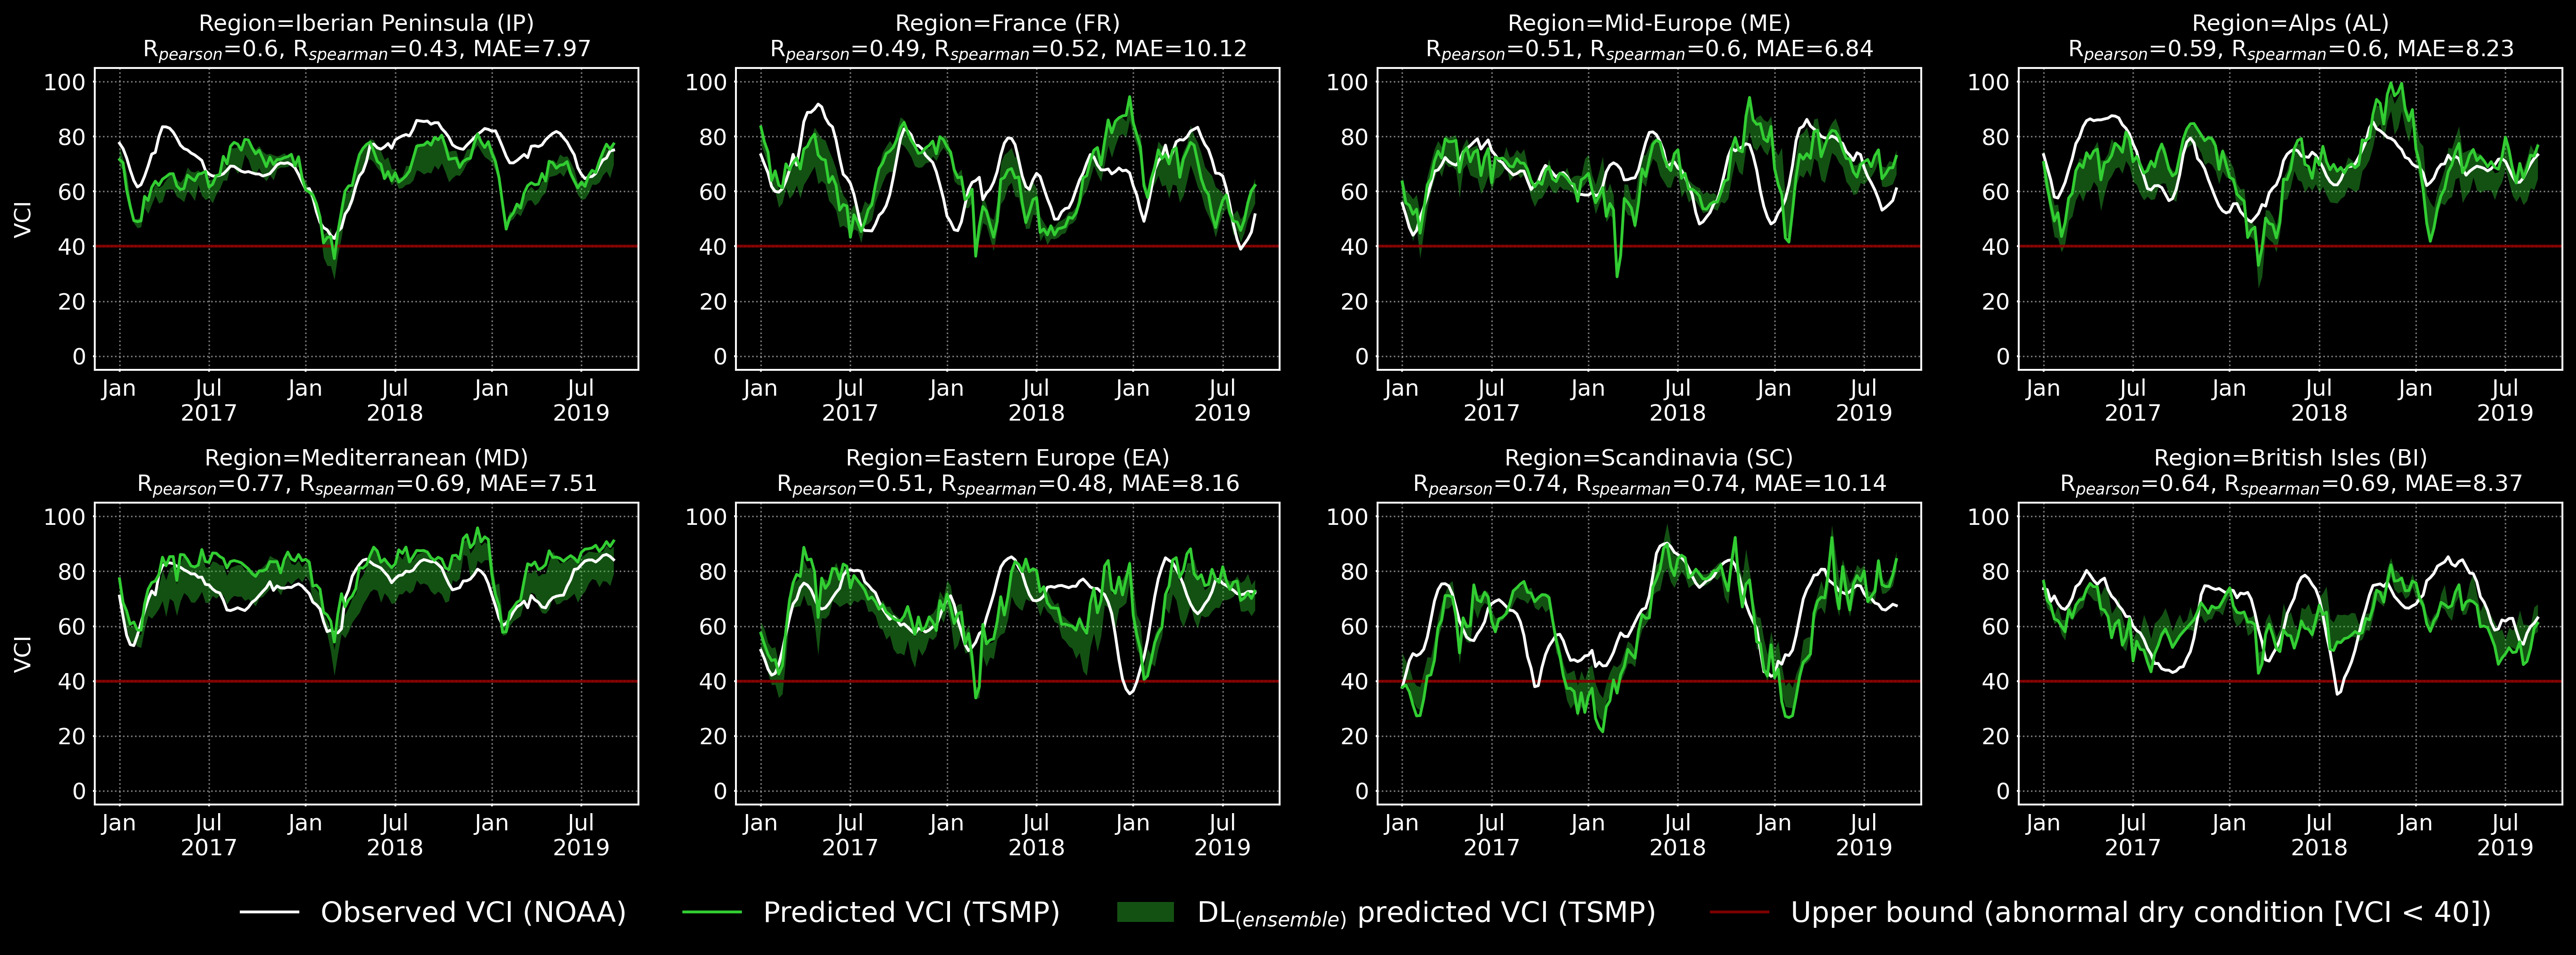
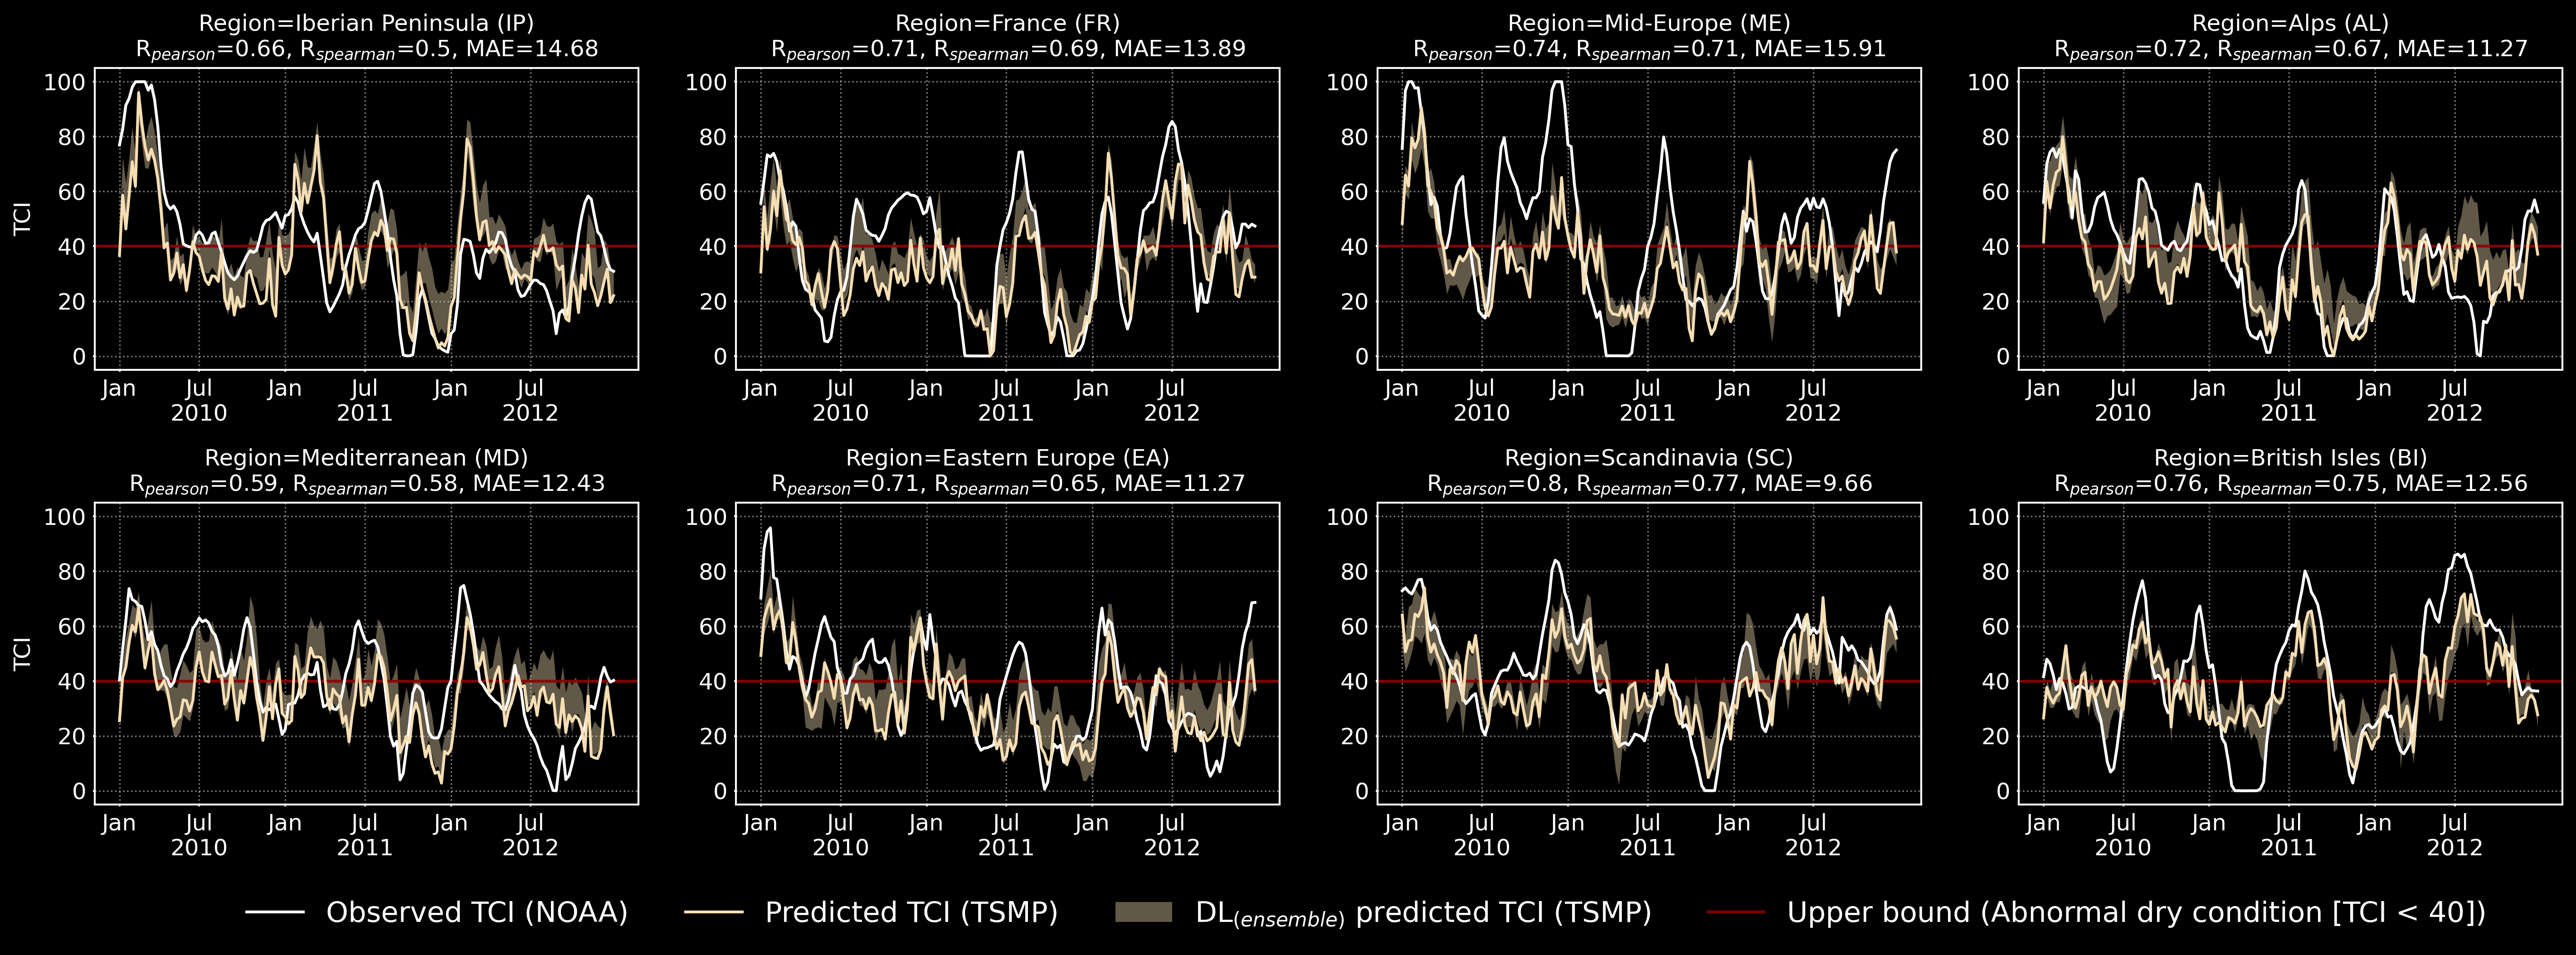
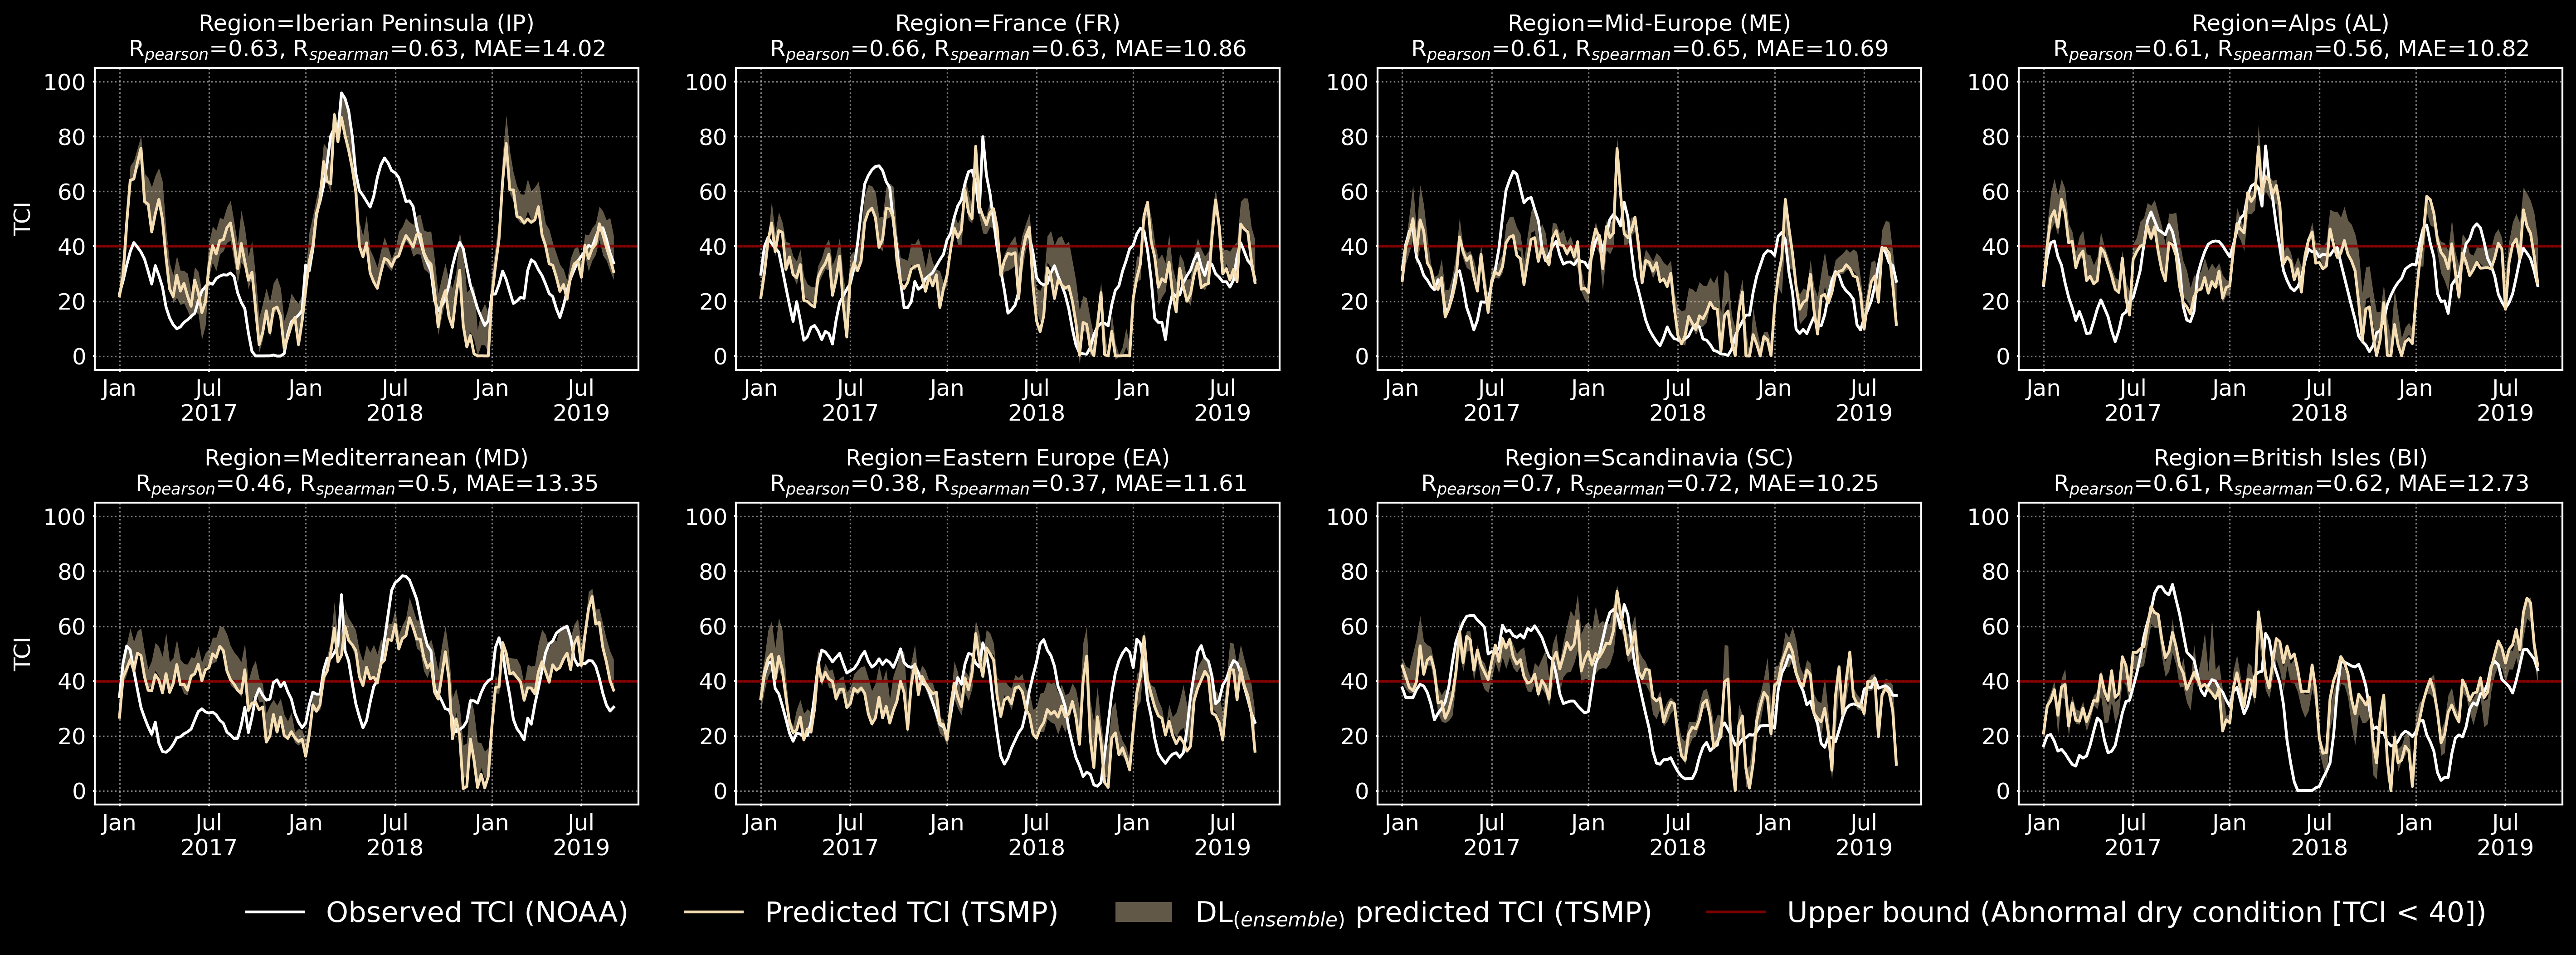
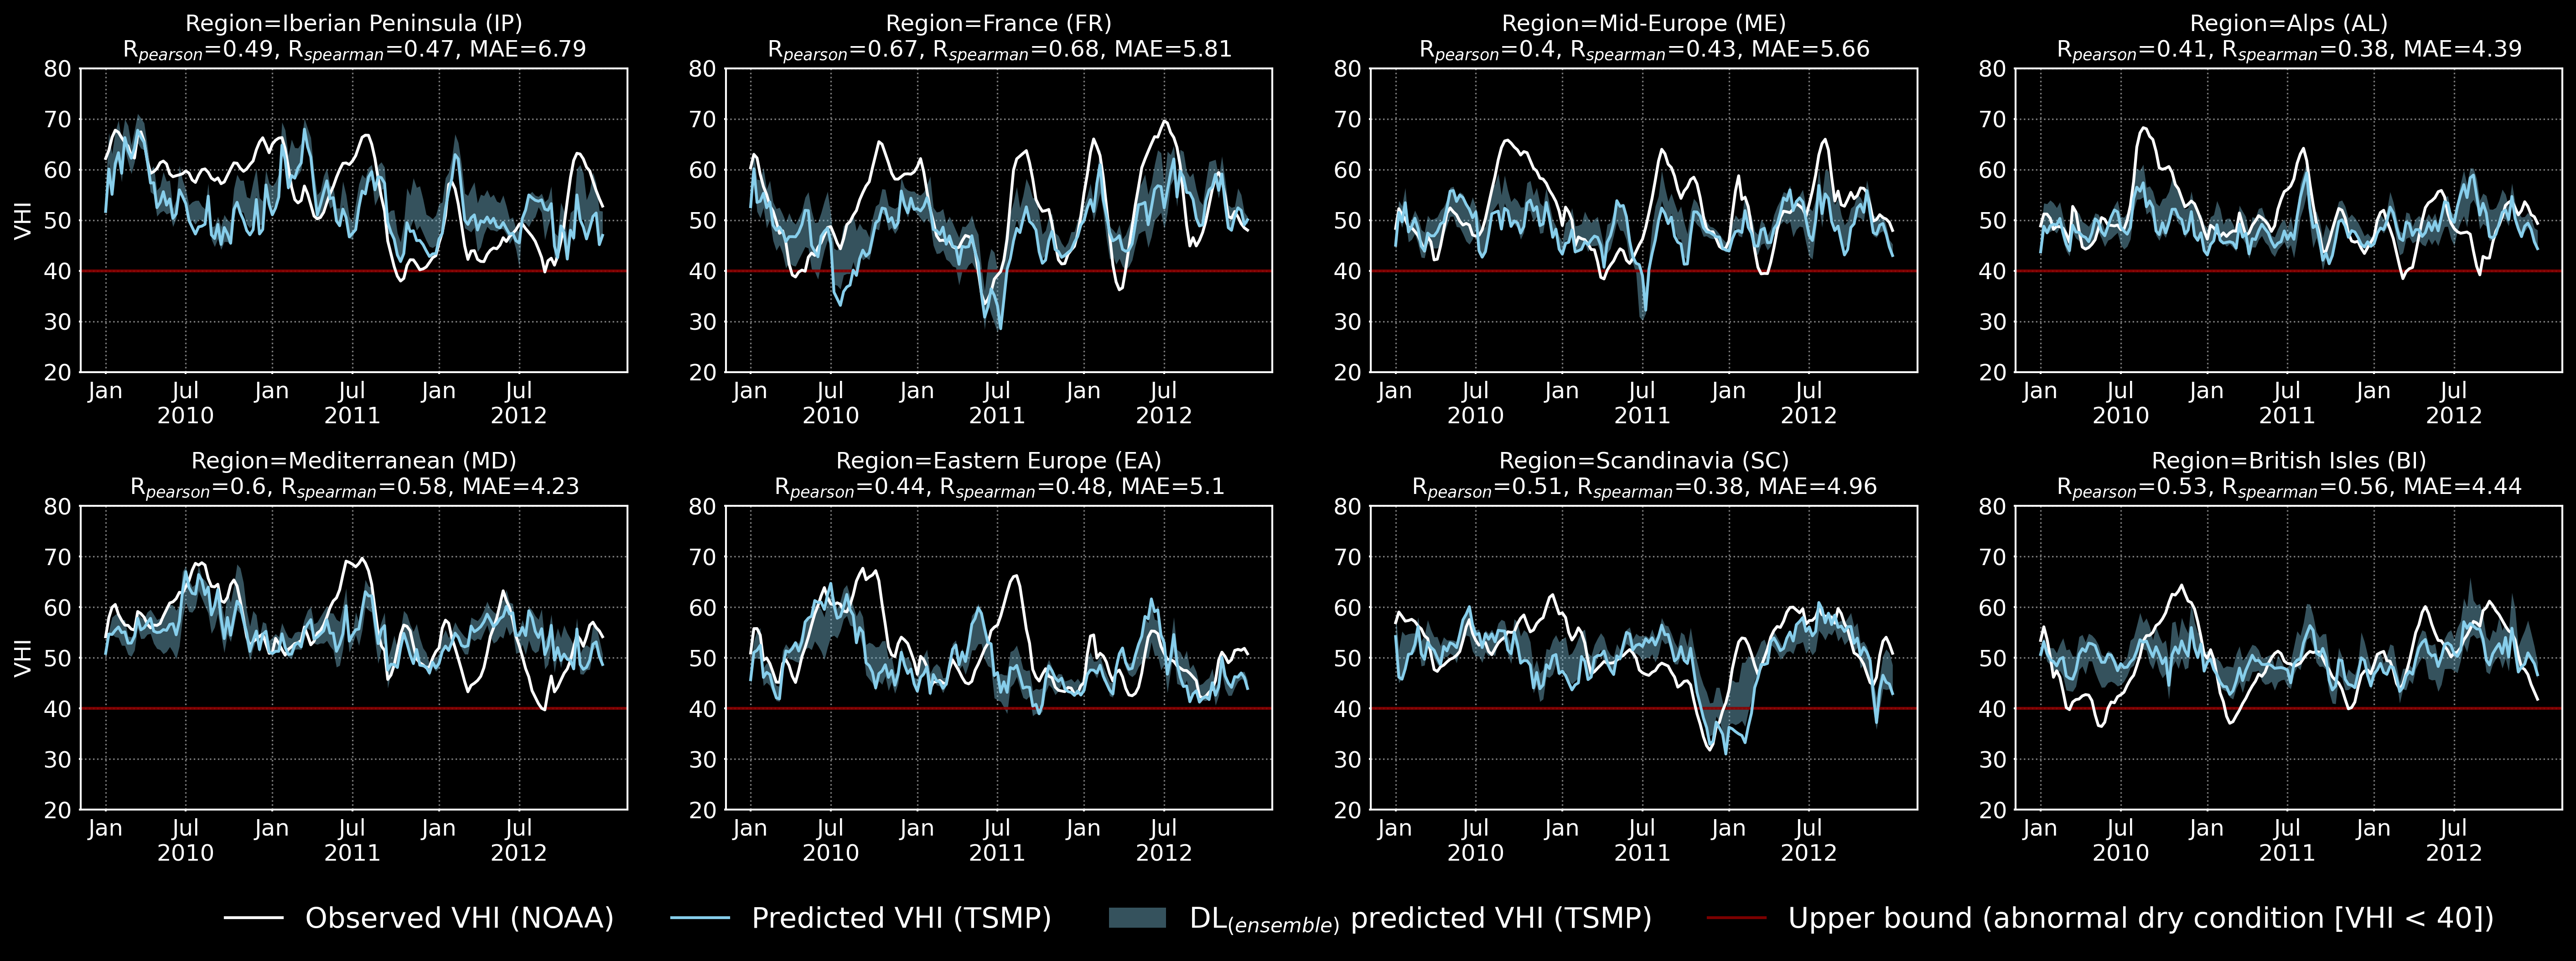
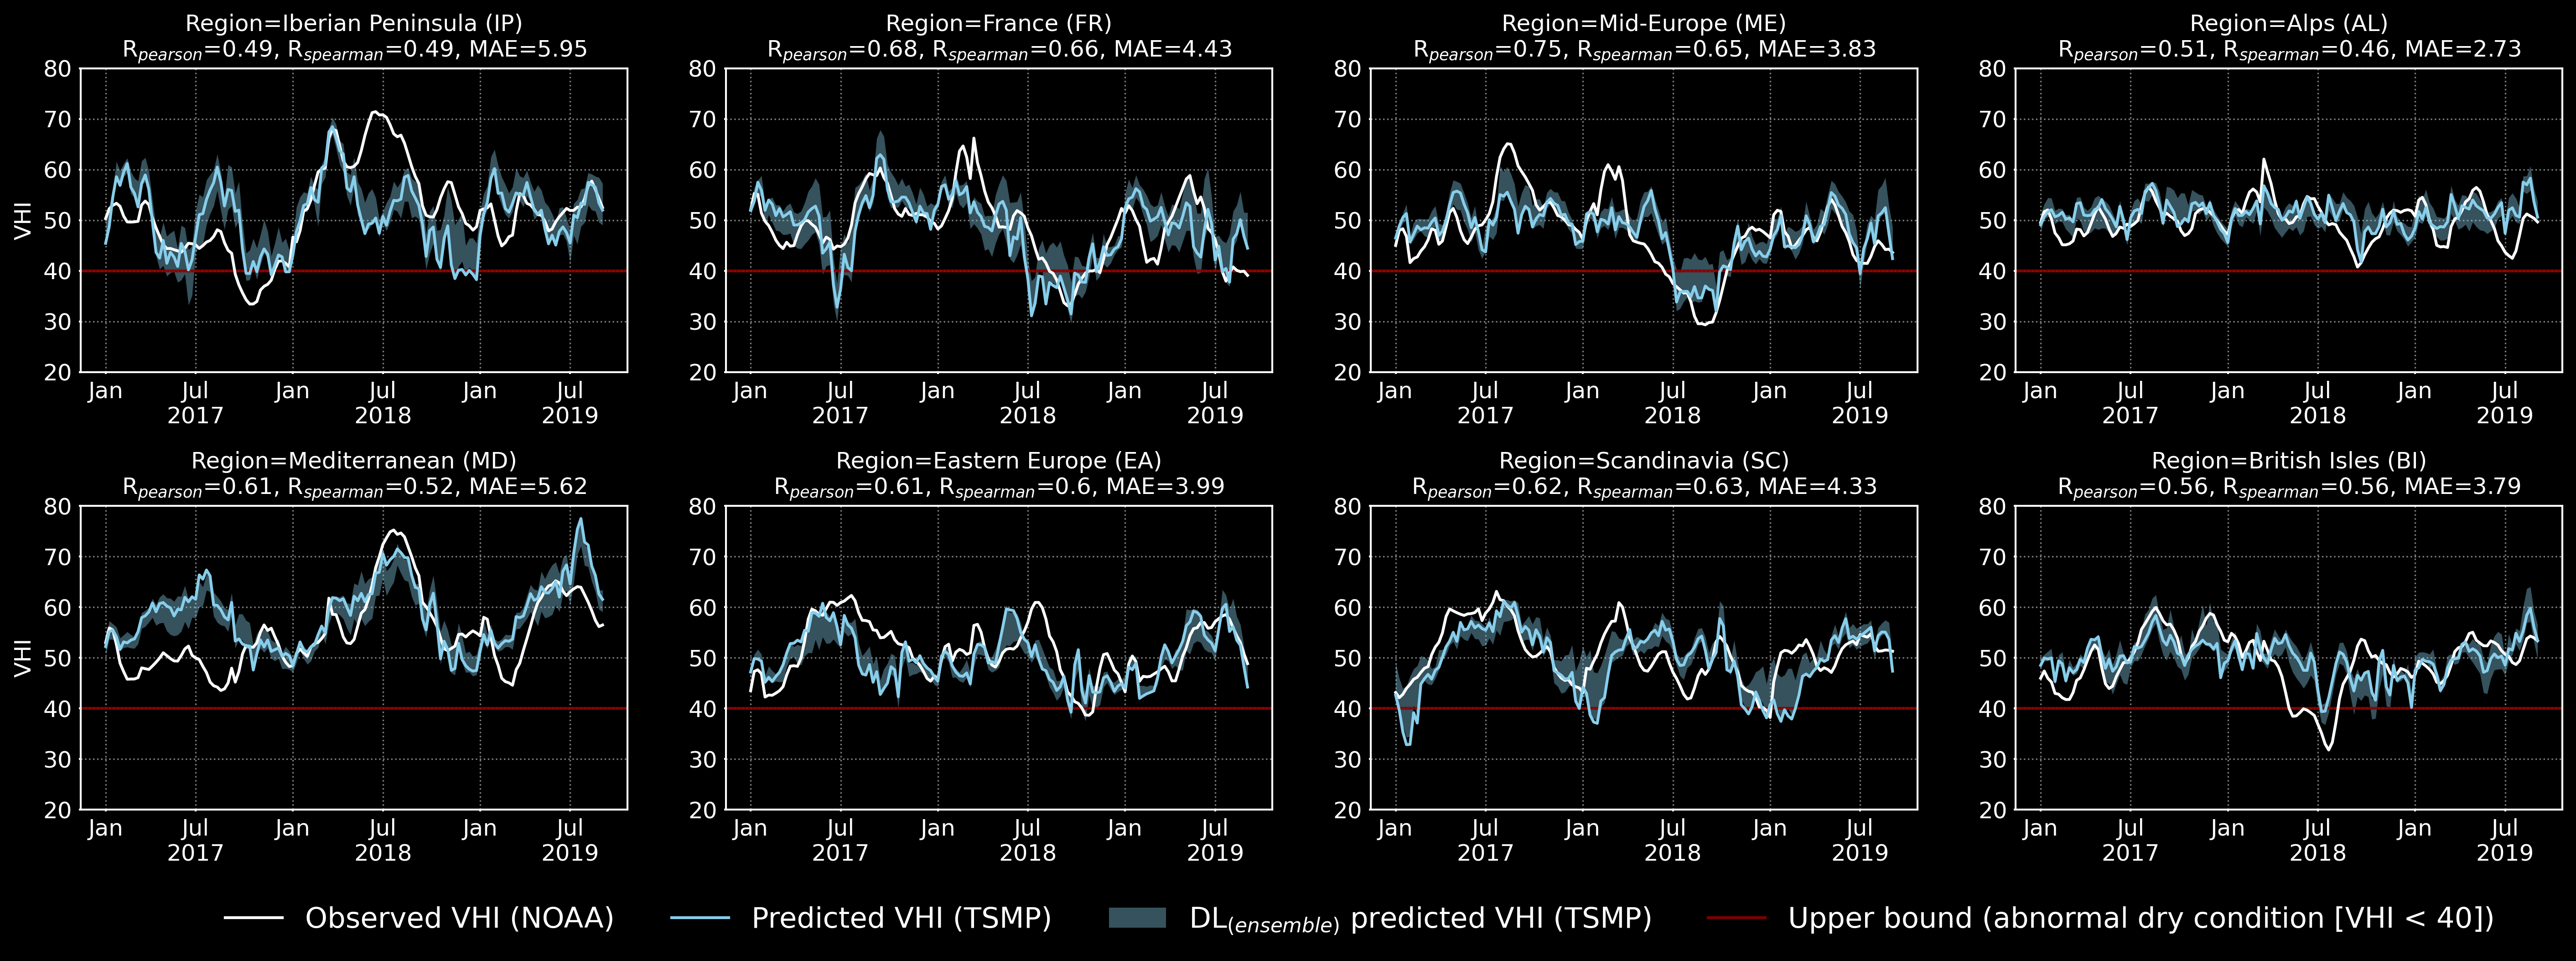
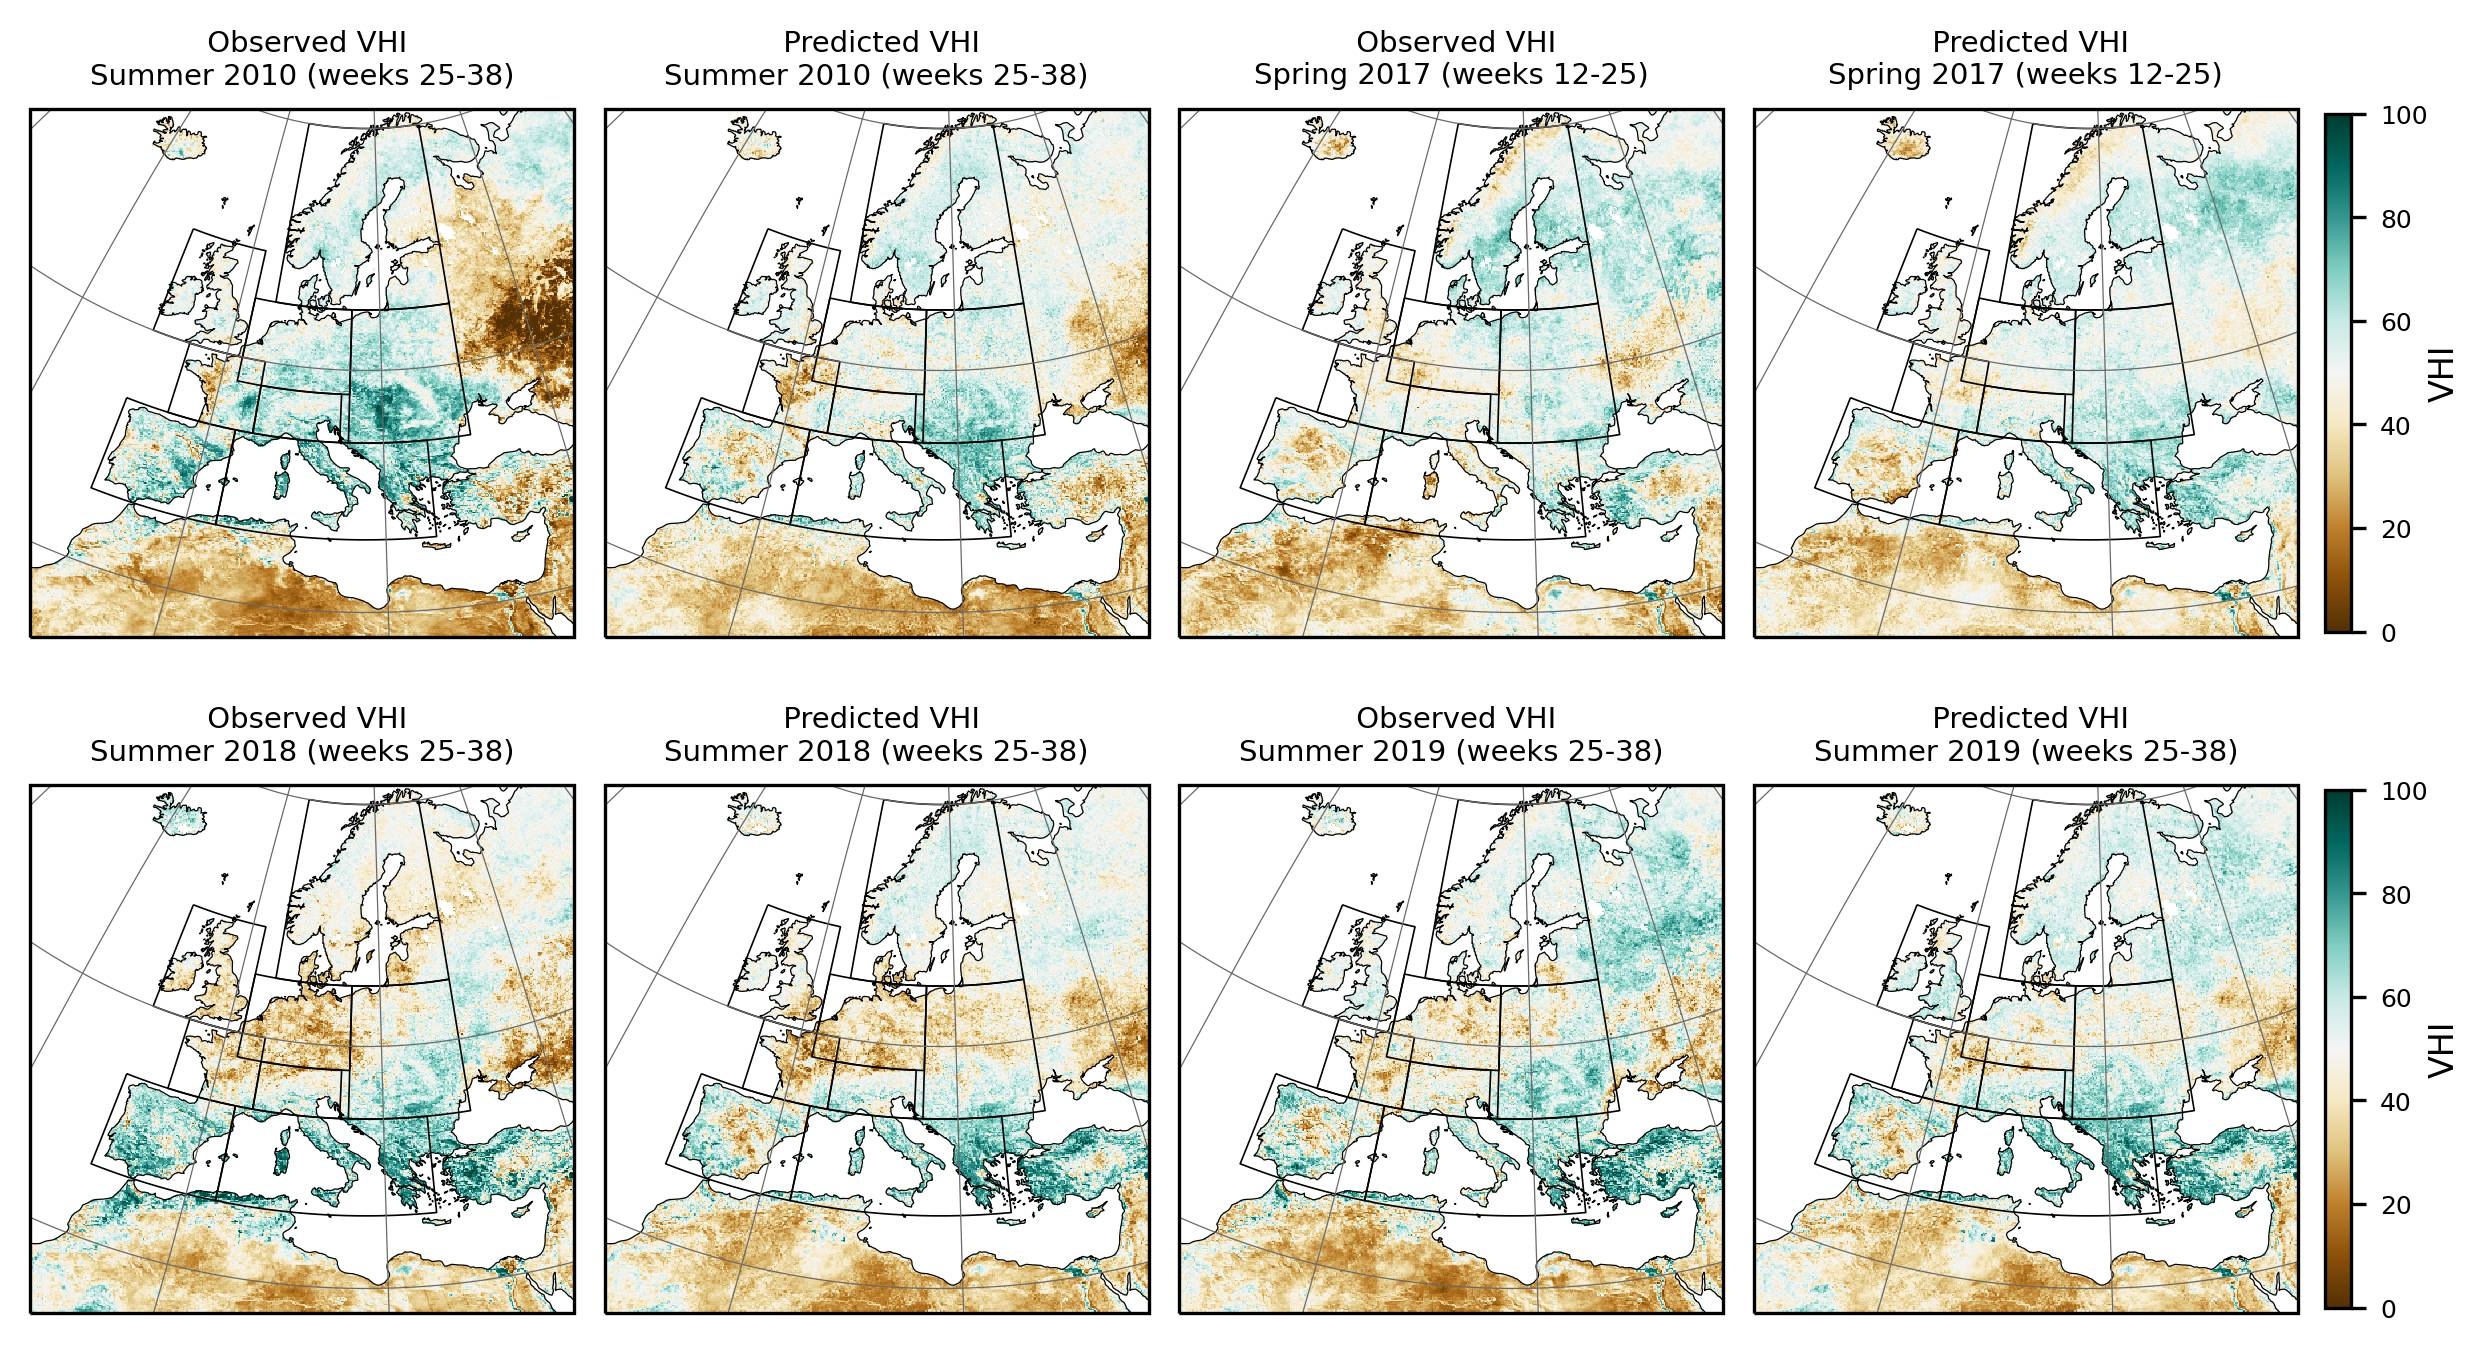
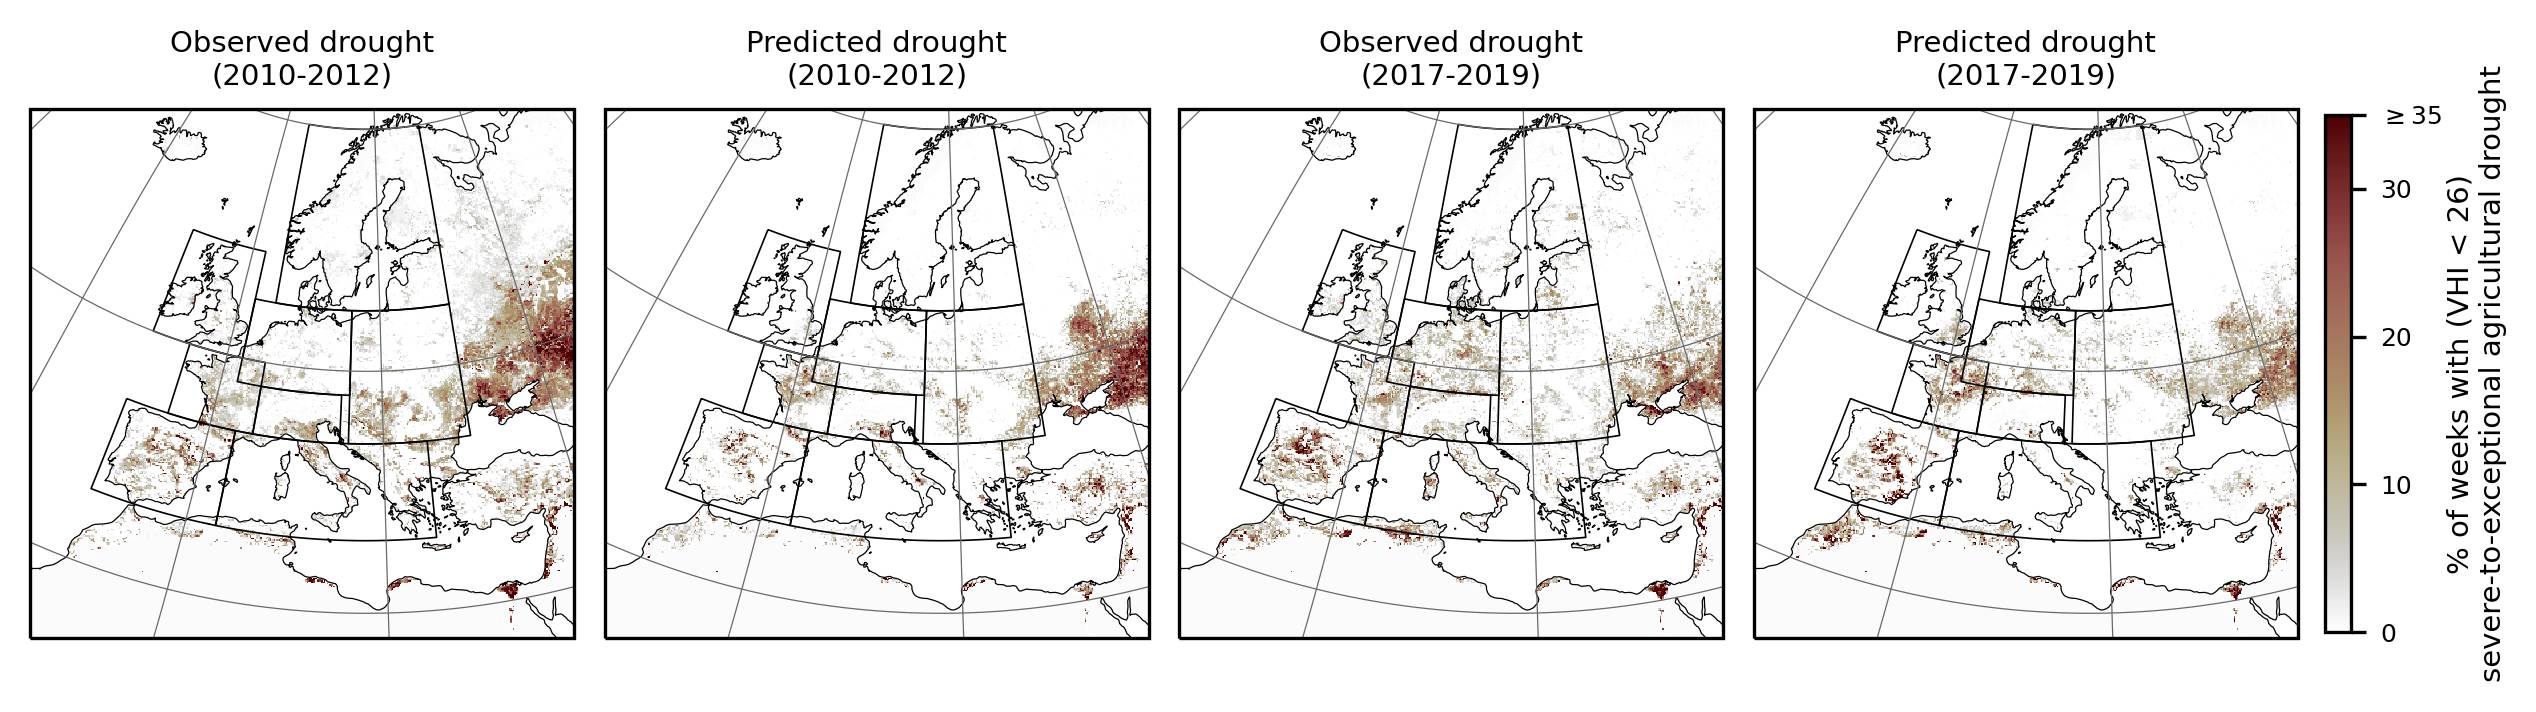
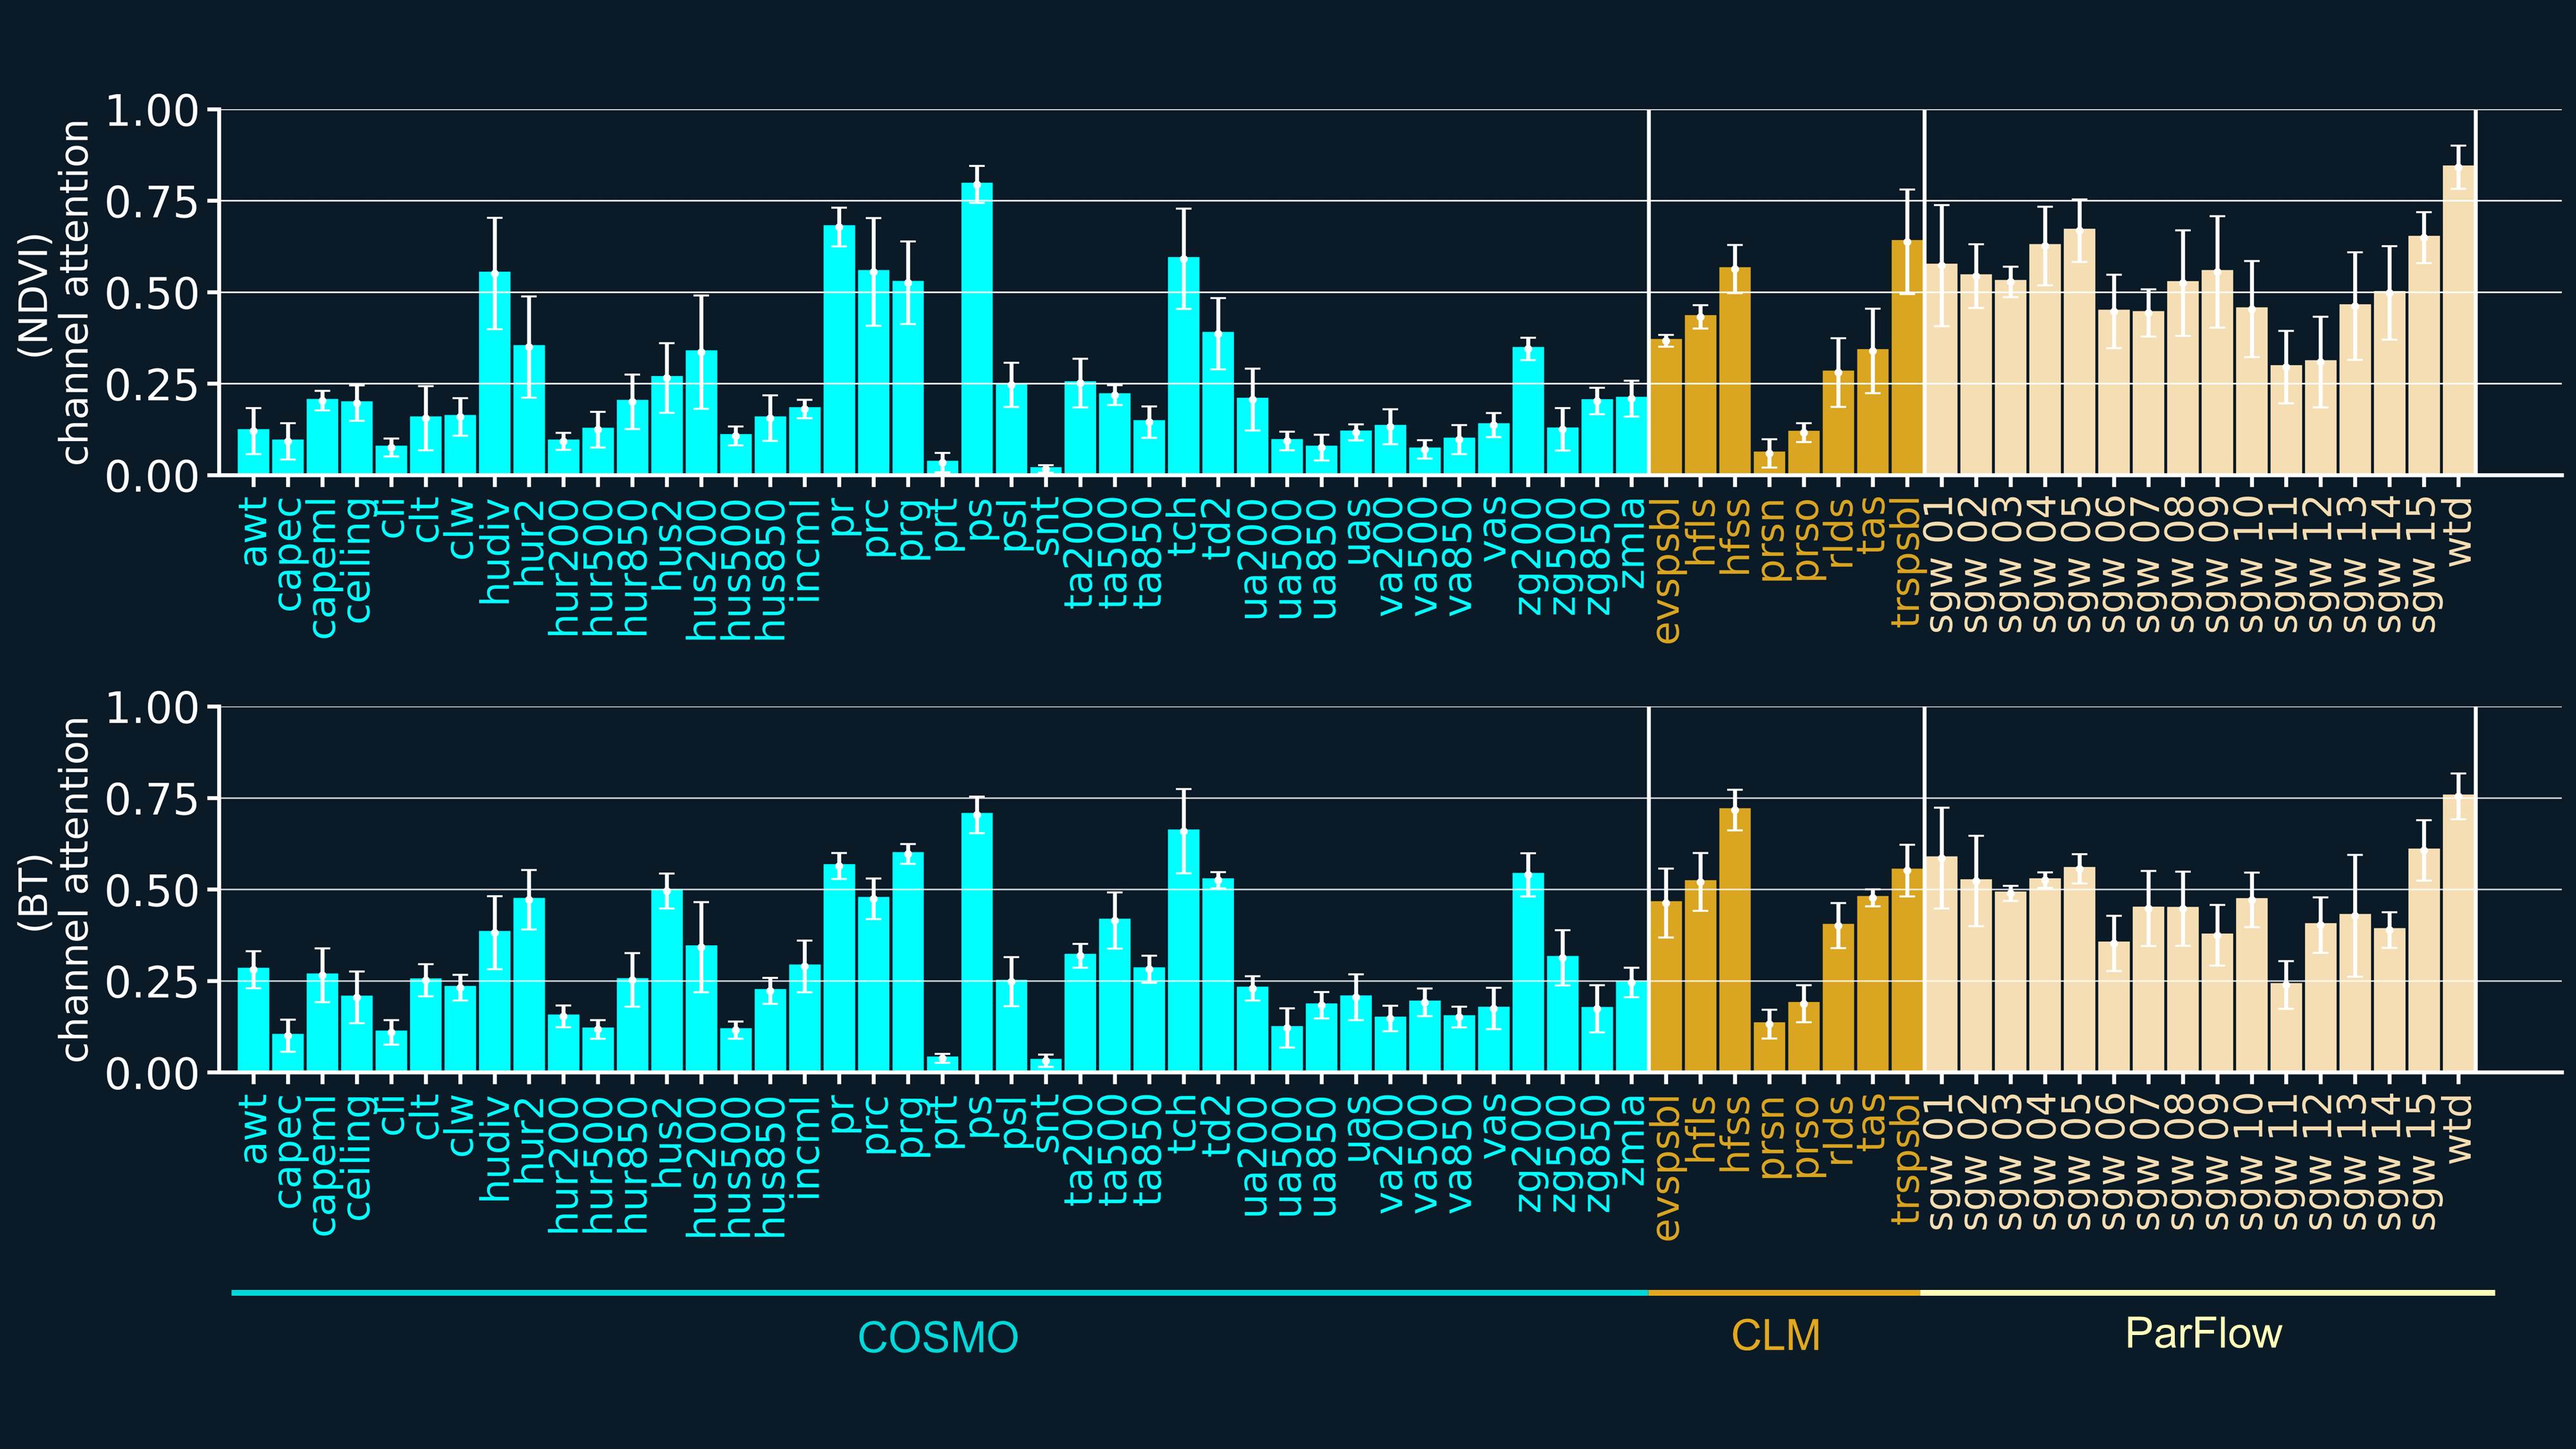
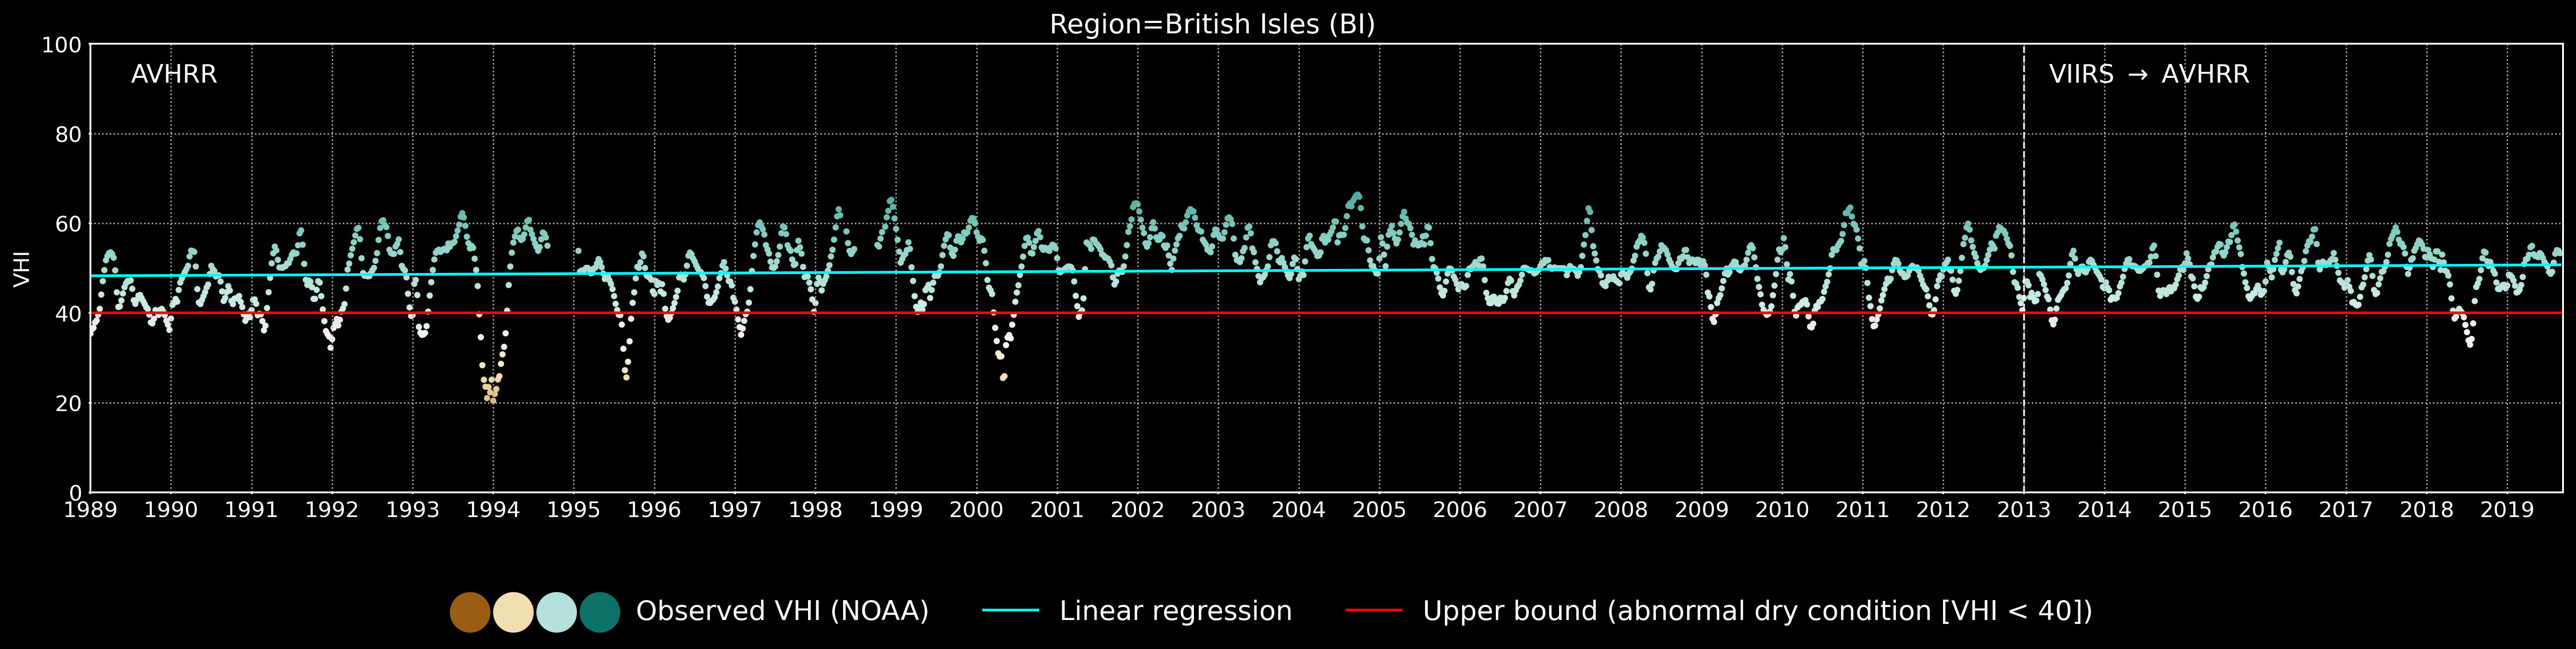
Satellite-derived agricultural drought indices can provide a complementary perspective of terrestrial vegetation trends. In addition, their integration for drought assessments under future climates is beneficial for providing more comprehensive assessments. However, satellite-derived drought indices are only available for the Earth observation era. In this study, we aim to improve the agricultural drought assessments under future climate change by applying deep learning (DL) to predict satellite-derived vegetation indices from a regional climate simulation. The simulation is produced by the Terrestrial Systems Modelling Platform (TSMP) and performed in a free evolution mode over Europe. TSMP simulations incorporate variables from underground to the top of the atmosphere (Ground to Atmosphere G2A) and are widely used for research studies related to water cycle and climate change. We leverage these simulations for long-term forecasting and DL to map the forecast variables into Normalized Difference Vegetation Index (NDVI) and Brightness Temperature (BT) images that are not part of the simulation model. These predicted images are then used to derive different vegetation and agricultural drought indices, namely NDVI anomaly (NDVIa), BT anomaly (BTa), Vegetation Condition Index (VCI), Thermal Condition Index (TCI), and Vegetation Health Index (VHI). The developed DL model could be integrated with data assimilation and used for down-stream tasks, i.e., for estimating NDVI and BT for periods where no satellite data are available and for modelling the impact of extreme events on vegetation responses with different climate change scenarios. Moreover, our study could be used as a complimentary evaluation framework for TSMP-based climate change simulations. To ensure reliability and to assess the model’s applicability to different seasons and regions, we provide an analysis of model biases and uncertainties across different regions over the Pan-Europe domain. We further provide an analysis about the contribution of the input variables from the TSMP model components to ensure a better understanding of the model prediction. A comprehensive evaluation on the long-term TSMP simulation using reference remote sensing data showed sufficiently good agreements between the model predictions and observations. While model performance varies on the test set between different climate regions, it achieves a mean absolute error (MAE) of 0.027 and 1.90 K with coefficient of determination (R2) scores of 0.88 and 0.92 for NDVI and BT, respectively, at 0.11° resolution for sub-seasonal predictions. In summary, we demonstrate the feasibility of using DL on a TSMP simulation to synthesize NDVI and BT satellite images, which can be used for agricultural drought forecasting.